Activity of reorganizing companies
Information agency Credinform presents a review of the activity trends of the companies being in process of reorganization. More than 6,5 thousands of such enterprises are registered in Russia.
ДThe largest companies (TOP-1000) in terms of annual revenue were selected for the analysis according to the data from the Statistical Register and the Federal Tax Service for the latest available accounting periods (2014 – 2019). The selection of companies and the analysis were based on the data from the Information and Analytical system Globas.
Net assets are total assets less total liabilities. This indicator reflects the real value of the property of an enterprise. When the company’s debt exceeds the value of its property, the indicator is considered negative (insufficiency of property).
The largest TOP-1000 company in term of net assets is AO ORENBURGNEFT, INN 5612002469, Orenburg region, extraction of petroleum, in process of reorganization by spin-off since 13.01.2021. In 2019, net assets value of the organization amounted to more than 758 billion RUB.
The lowest net assets value among TOP-1000 was recorded for LLC AFIPKA NPZ, INN 7704214548, Krasnodar region, manufacture of petroleum products, in process of reorganization in the form of acquisition of other legal entities since 14.01.2021. In 2019, insufficiency of property of the organization was indicated in negative value of more than -17 billion RUB.
During six-year period, the average net assets values of TOP-1000 have a trend to increase, with the decreasing growth rates (Picture 1).
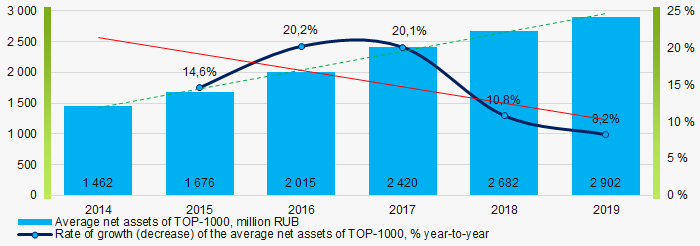 Picture 1. Change in average net assets value in TOP-1000 in 2014 - 2019
The shares of TOP-1000 organizations with negative net assets value had positive trend to decrease during last 6 years (Picture 2).
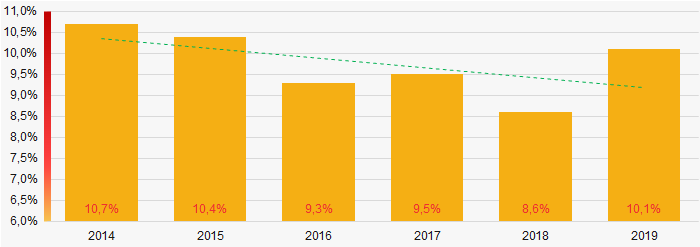 Picture 2. Shares of TOP-1000 organizations with insufficient property in 2014 - 2019
Sales revenue
The largest TOP-1000 company in term of net assets is Mobile TeleSystems JSC, INN 7740000076, Moscow, wireless telecommunications activities, in process of reorganization in the form of acquisition of other legal entities since 17.03.2020. In 2019, revenue of the organization amounted to more than 342 billion RUB.
In general, there is a trend to increase in revenue with increasing growth rates (Picture 3).
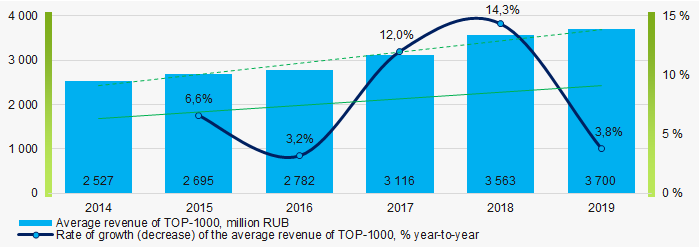 Picture 3. Change in average revenue of TOP-1000 in 2014– 2019
Profit and loss
The largest company in term of net profit is AO ORENBURGNEFT. The company’s profit exceeded 72 billion RUB in 2019.
During six-year period, the average profit figures have a trend to increase with decreasing growth rates (Picture 4).
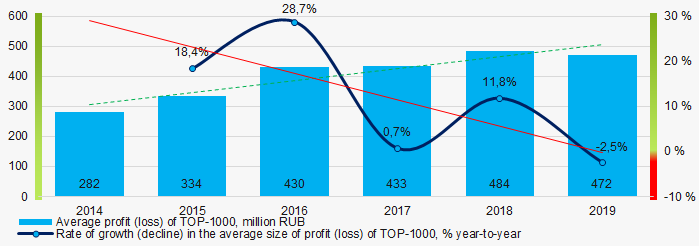 Picture 4. Change in average profit (loss) of TOP-1000 companies in 2014- 2019
During six-year period, the average net profit figures of TOP-1000 companies have a trend to increase with the decreasing average net loss (Picture 5).
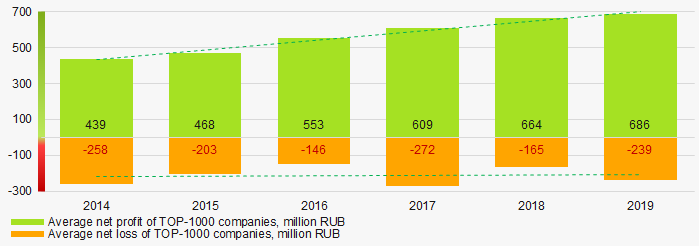 Picture 5. Change in average net profit and net loss of ТОP-1000 companies in 2014 – 2019
Key financial ratios
During six-year period, the average values of the current liquidity ratio of TOP-1000 companies were above the recommended one – from 1,0 to 2,0, with a trend to decrease. (Picture 6).
Current liquidity ratio (current assets to short-term liabilities) shows the sufficiency of company’s assets to repay on short-term liabilities.
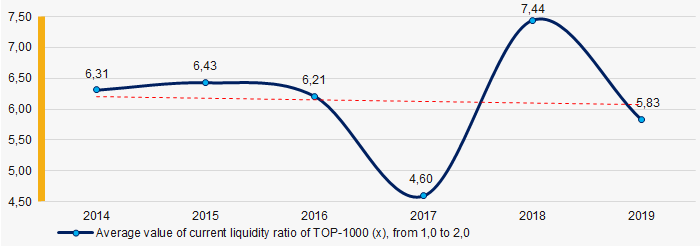 Picture 6. Change in average values of current liquidity ratio of TOP-1000 in 2014 – 2019
During six years, the average ROI values had a trend to increase (Picture 7).
ROI ratio is calculated as net profit to sum of shareholders equity and long-term liabilities, and shows the return of equity involved in commercial activities and long-term borrowed funds.
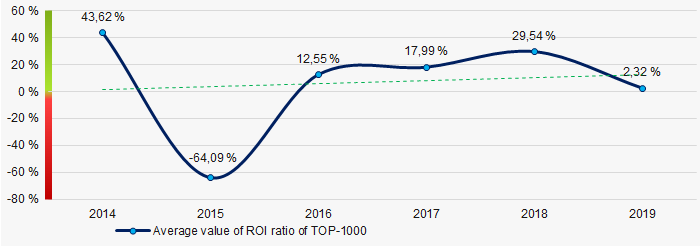 Picture 7. Change in average values of ROI ratio of TOP-1000 in 2006 – 2011
Assets turnover ratio is the ratio of sales revenue and company’s average total assets for a period. It characterizes the effectiveness of using of all available resources, regardless the source of their attraction. The ratio shows how many times per year the full cycle of production and circulation is performed, generating the corresponding effect in the form of profit.
During the six-year period, there was a trend to decrease of this ratio (Picture 8).
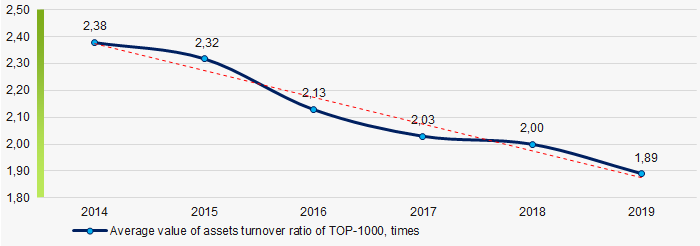 Picture 8. Change in average values of assets turnover ratio of TOP-1000 companies in 2014 – 2019
Small enterprises
62% companies of TOP-1000 are registered in the Register of small and medium-sized enterprises of the Federal Tax Service of the Russian Federation. However, their share in total revenue of TOP-1000 amounted 3,7%, which is significantly lower than the average country values in 2018 - 2019 (Picture 9).
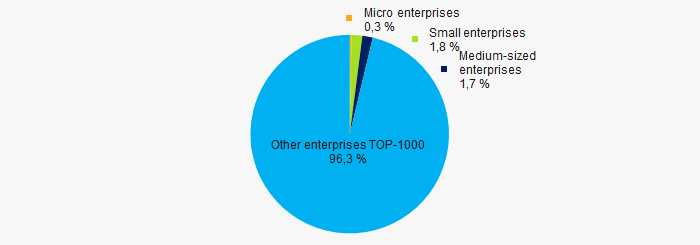 Picture 9. Shares of small and medium-sized enterprises in TOP-1000
Main regions of activity
Companies of TOP-1000 are registered in 80 regions of Russia, and unequally located across the country. Almost 49% of largest by revenue companies consolidate in Moscow and Samara region (Picture 10).
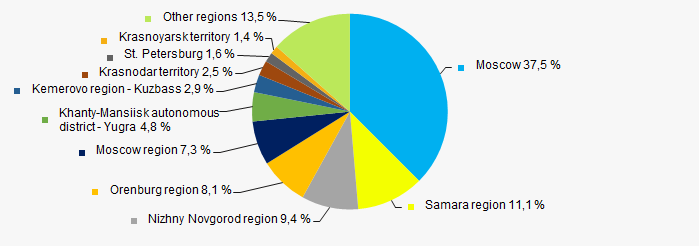 Picture 10. Distribution of TOP-1000 revenue by the regions of Russia
Financial position score
According to the assessment, the financial position of most of TOP-1000 companies is above average (Picture 11).
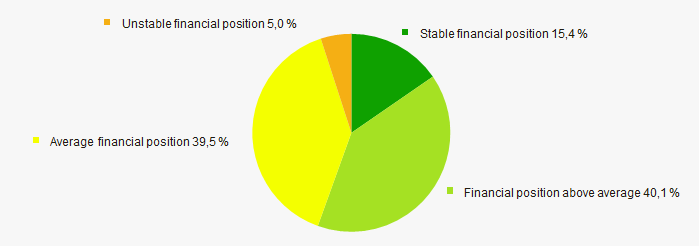 Picture 11. Distribution of TOP-1000 companies by financial position score
Solvency index Globas
Most of TOP-1000 companies got Superior / High and Strong / Medium index Globas. This fact shows their ability to meet their obligations fully and by the due date (Picture 12).
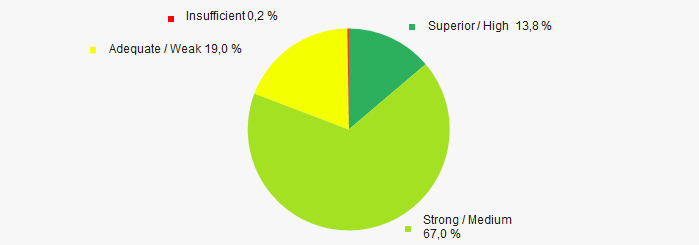 Picture 12. Distribution of TOP-1000 companies by solvency index Globas
Conclusion
Complex assessment of activity of the largest companies being in process of reorganization, taking into account the main indexes, financial ratios and indicators, demonstrates the prevalence of positive trends in their activity in 2014 - 2019 (Table 1).
| Trends and evaluation factors | Relative share of factor, % |
| Dynamics of the average net assets value |  10 10 |
| Rate of growth (decline) in the average size of net assets |  -10 -10 |
| Increase / decrease in the share of enterprises with negative values of net assets |  10 10 |
| Dynamics of the average revenue |  10 10 |
| Rate of growth (decline) in the average size of revenue |  10 10 |
| Dynamics of the average profit (loss) |  10 10 |
| Rate of growth (decline) in the average size of profit (loss) |  -10 -10 |
| Growth / decline in average values of companies’ net profit |  10 10 |
| Growth / decline in average values of companies’ net loss |  10 10 |
| Increase / decrease in average values of current liquidity ratio |  -5 -5 |
| Increase / decrease in average values of return on investment ratio |  10 10 |
| Increase / decrease in average values of asset turnover ratio, times |  -10 -10 |
| Share of small and medium-sized businesses in terms of revenue being more than 22% |  -10 -10 |
| Regional concentration |  -10 -10 |
| Financial position (the largest share) |  10 10 |
| Solvency index Globas (the largest share) |  10 10 |
| Average value of relative share of factors |  2,8 2,8 |
 positive trend (factor),
  negative trend (factor)
Legislation Changes
The Letter of the Federal Tax Service of Russia (FTS) No. BV-4-7/3060@ dated 10/03/2021, issued in followup of the monitoring process of law enforcement and litigation, provides new clarifications on the application of the Article 54.1 of the Tax Code of the Russian Federation (TC RF), which stipulates the right of the tax authorities to alter the legal qualification of the taxpayers’ transactions, their status and the nature of their businesses; it establishes the criteria for assessment of the transactions for taxation purposes.
The aim of this document of the FTS is to contribute to combating the abuse in the area of formal document flow, in cases when companies do not operate in the market, or when these are so-called ‘technical’ companies. Most often, they are shell companies.
In particular, tax authorities are supposed to establish not only the facts of default by competent persons, but also the circumstances indicating the intended reduction of tax liabilities by tax payers. Such circumstances may include the data that the taxpayer knew or could have known in advance that their counterparty is a ‘technical’ company.
The legal positions regarding the selection of counterparties and their assessment for tax purposes are set out in paragraph 31 of the Judicial Review of the Presidium of the Supreme Court of the Russian Federation dated 16/02/2017 and in the rulings of the Supreme Court of the Russian Federation No. 309-ES20-17277 dated 25/01/2021 and No. 305-ES19-16064 dated 28/05/2020.
The mechanism for overstating the costs incurred and, therefore, reducing the tax base lies in embedding 'technical' companies in between the taxpayers and the persons who actually settle the transactions.
The tax authorities are recommended to calculate the actual amount of the taxpayers’ liabilities if such tax optimization methods are detected, i.e. it implies additional tax assessment that should have been paid in the absence of abuse.
The tax authorities have been instructed that VAT compliance expenses and credits for such operations under dispute should include the facts established via use of:
- information and documents submitted by taxpayers themselves;
- data obtained during tax control;
- requested documents or information about specific transactions from suppliers, contractors, and providers who actually settled the transactions.
In cases of the absence of relevant information and supporting documents, taxpayers do not have the right to apply tax deductions and record expenses incurred on transactions under dispute.
Thus, if in the absence of the above-mentioned evidence, via the analysis of the specifics of counterparties and the terms of transactions by tax authorities, it shall be established that the transactions do not comply with the terms of business practice, it can be concluded that taxpayers should have known in advance about the transactions with ‘technical’ companies.