Trends in special construction
Information agency Credinform has prepared a review of trends of the largest Russian companies engaged in special construction.
The largest companies (TOP-100) in terms of annual revenue were selected for the analysis according to the data from the Statistical Register for the latest available periods (2013-2018). The selected companies are engaged in dismantling and demolition of buildings, preparation of building sites, electrical, plumbing, finishing, roofing and waterproofing, as well as installation of scaffolding and foundation construction, pouring concrete, stones and bricks laying, installation and assembly of building structures. The analysis was based on the data of the Information and Analytical system Globas.
Net assets are total assets less total liabilities. This indicator reflects the real value of the property of an enterprise. When the company’s debt exceeds the value of its property, the indicator is considered negative (insufficiency of property).
The largest company in term of net assets is JSC KURSK FACTORY OF LARGE-PANEL HOUSING CONSTRUCTION NAMED AFTER AFDERIGLAZOV, INN 4630005929, Kursk region. In 2018, net assets value of the company amounted to 15,2 billion RUB.
The lowest net assets volume among TOP-100 belonged to JSC RZDSTROY, INN 7708587205, Moscow. In 2018, insufficiency of property of the company was indicated in negative value of -4 million RUB.
Covering the ten-year period, the average net assets values have a trend to decrease (Picture 1).
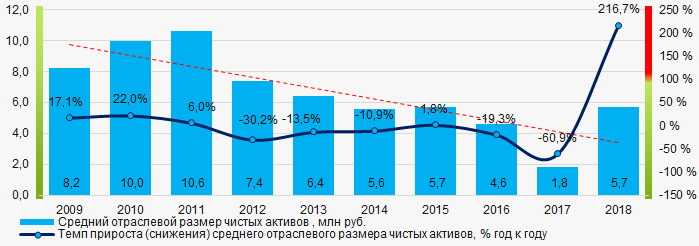 Picture 1. Change in average net assets value in 2009 – 2018
The shares of TOP-1000 companies with insufficient property have trend to increase over the past five years (Picture 2).
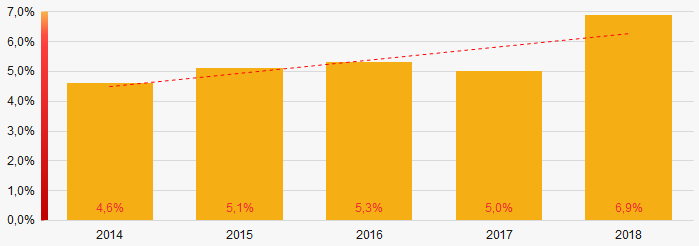 Picture 2. Shares of companies with negative net assets value in TOP-1000
Sales revenue
In 2018, the revenue volume of 10 largest companies of the industry was almost 26% of total TOP-1000 revenue (Picture 3). This is indicative of relatively high level of intraindustry competition.
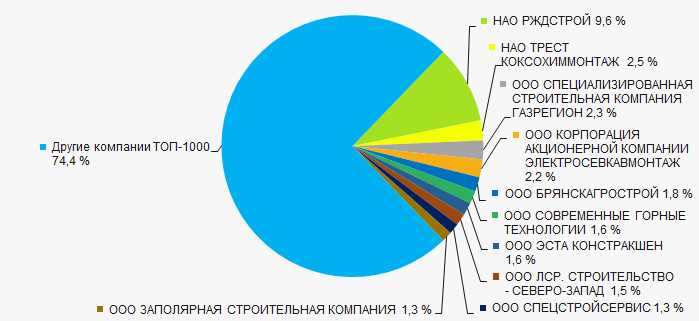 Picture 3. The share of TOP-10 companies in total 2018 revenue of TOP-1000
In general, there is a trend to decrease in revenue (Picture 4).
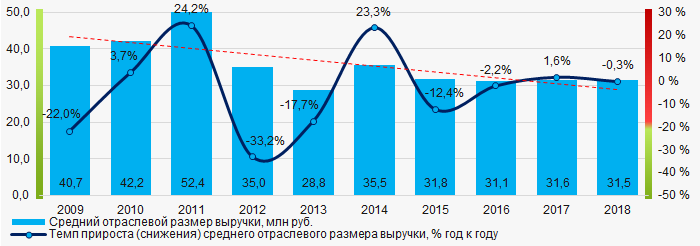 Picture 4. Change in industry average net profit in 2009-2018
Profit and loss
The largest company in term of net profit is LLC CORPORATION OF JSC ELEKTROSEVKAVMONTAZH, INN 2312065504, Krasnodar territory. The company’s profit for 2018 amounted to 1,9 billion RUB.
Over the five-year period, there is a trend to decrease in average net profit (Picture 5).
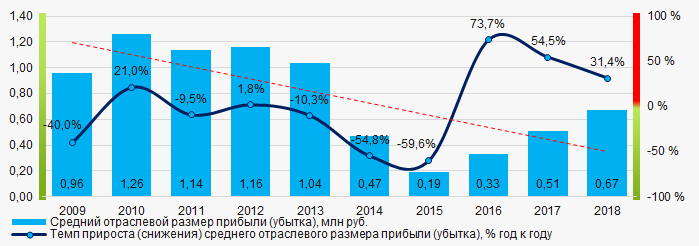 Picture 5. Change in industry average net profit (loss) values in 2009 – 2018
For the five-year period, the average net profit values of TOP-1000 companies are relatively stable with no clear trend. At the same time, the average net loss values have a decreasing trend (Picture 6).
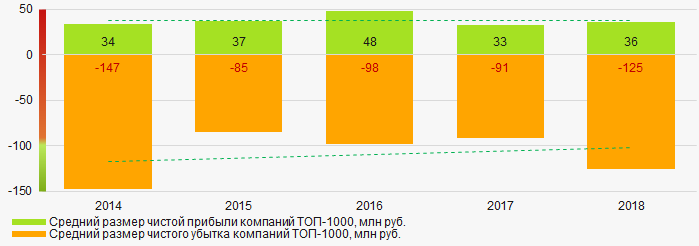 Picture 6. Change in average net profit and net loss of ТОP-1000 in 2014 – 2018
Key financial ratios
For the ten-year period, the average values of the current liquidity ratio were significantly above the recommended one - from 1,0 to 2,0 with a trend to decrease (Picture 7).
Current liquidity ratio (current assets to short-term liabilities) shows the sufficiency of company’s assets to repay on short-term liabilities.
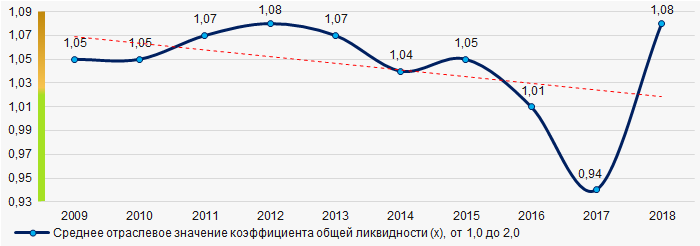 Picture 7. Change in industry average values of current liquidity ratio in 2009 – 2018
For the ten-year period, the average values of ROI ratio have a trend to increase (Picture 8).
ROI ratio is calculated as net profit to sum of shareholders equity and long-term liabilities, and shows the return of equity involved in commercial activities and long-term borrowed funds.
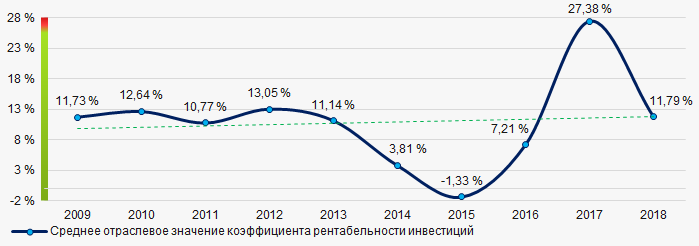 Picture 8. Change in average values of ROI ratio in 2009 – 2018
Assets turnover ratio is the ratio of sales revenue and company’s average total assets for a period. It characterizes the effectiveness of using of all available resources, regardless the source of their attraction. The ratio shows how many times per year the full cycle of production and circulation is performed, generating the corresponding effect in the form of profit.
For the five-year period, business activity ratio demonstrated the decreasing trend (Picture 9).
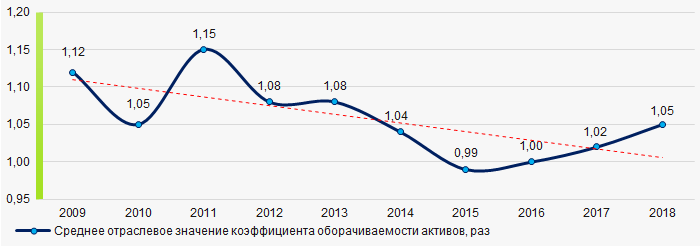 Picture 9. Change in average values of assets turnover ratio in 2009 – 2018
Small business
70% companies of TOP-1000 are registered in the Register of small and medium-sized enterprises of the Federal Tax Service of the Russian Federation. At the same time, their share in total revenue of TOP-1000 companies amounted to 25,9% that is higher than the national average figure (Picture 10).
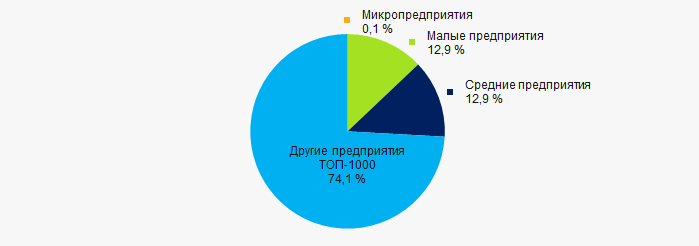 Picture 10. Shares of small and medium-sized enterprises in TOP-1000
Main regions of activity
Companies of TOP-1000 are registered in 71 regions of Russia, and unequally located across the country. Over 44% of companies largest by revenue are located in Moscow and Saint Petersburg (Picture 114).
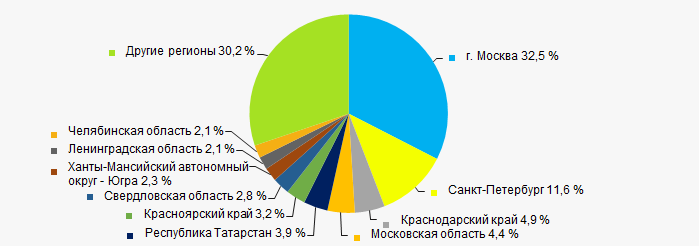 Picture 11. Distribution of TOP-1000 revenue by regions of Russia
Financial position score
Assessment of the financial position of TOP-1000 companies shows that the majority of them have financial position above average (Picture 12).
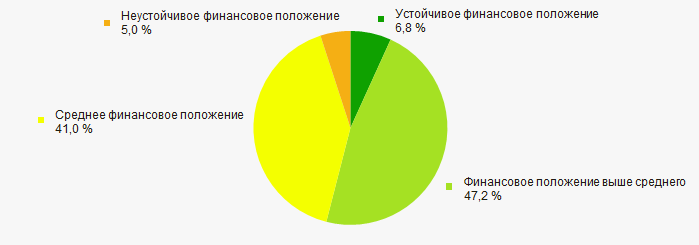 Picture 12. Distribution of TOP-1000 companies by financial position score
Solvency index Globas
Most of TOP-1000 companies got Superior / High and Strong / Medium index Globas. This fact shows their ability to meet their obligations fully (Picture 13).
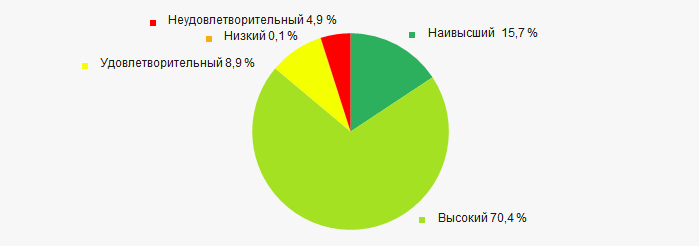 Picture 13. Distribution of TOP-1000 companies by solvency index Globas
According to the Federal state statistics service, the share of companies in total revenue from sales of goods, works and services was 0,56% for 2018, and 0,572% for 9 months of 2019. It is lower than the volume for the same period of 2018 with 0,827%.
Conclusion
Complex assessment of activity of the largest Russian companies engaged in special construction, taking into account the main indexes, financial ratios and indicators, demonstrates the prevalence of positive trends (Table 1).
| Trends and evaluation factors | Relative share of factors, % |
| Rate of growth (decline) in the average size of net assets |  -10 -10 |
| Increase / decrease in the share of enterprises with negative values of net assets |  -10 -10 |
| Level of competition / monopolization |  10 10 |
| Rate of growth (decline) in the average size of revenue |  -10 -10 |
| Rate of growth (decline) in the average size of profit (loss) |  -10 -10 |
| Growth / decline in average values of companies’ net profit |  5 5 |
| Growth / decline in average values of companies’ net loss |  10 10 |
| Increase / decrease in average values of total liquidity ratio |  -5 -5 |
| Increase / decrease in average values of return on investment ratio |  10 10 |
| Increase / decrease in average values of asset turnover ratio, times |  -10 -10 |
| Share of small and medium-sized businesses in terms of revenue being more than 21% |  10 10 |
| Regional concentration |  -10 -10 |
| Financial position (the largest share) |  10 10 |
| Solvency index Globas (the largest share) |  10 10 |
| Dynamics of the share of revenue in total revenue in RF |  5 5 |
| Average value of relative share of factors |  0,3 0,3 |
 positive trend (factor),
  negative trend (factor).
Legislative changes
The Federal Law №8-FZ dated 06.02.2020 amended Articles 346.43 and 346.45 of the second chapter of the Tax Code of the RF.
Item 2 of Article 346.43 of the Tax Code of the RF contains a list of types of business activity to relation of which the Patent tax system (PTS) is applied.
As adopted by the amendments, PTS will be applied to the following activities since 01.01.2021:
- photography services;
- activities in the field of preschool education and additional education of children and adults;
- services for preparation and delivery of dishes for celebrations and other events;
- services for slaughtering and transportation of livestock;
- plant growing, animal breeding and services in these areas.
To establish a single amount of annual income that is possible to receive, the subjects of the Russian Federation are given the right to combine the types of entrepreneurship in animal breeding and plant growing in one patent, as well as services in these areas of activity.
It is worth reminding that the Patent tax system is a special tax regime, in which sole proprietors pay one tax at a fixed tax rate and are exempt from other taxes. Sole proprietors can apply the patent tax system, whose average number of employees does not exceed 15 people for the tax period, for all types of business activity.
The Patent tax system cannot be applied to:
- business activity within the framework of a simple partnership agreement, joint venture agreement or fiduciary management agreement;
- activities on sale of goods, being not related to the retail trade (excisable goods and products, being liable for obligatory labeling of means of identification).
More information about the Patent tax system can be found in our publication «Patent tax system in 2015».
Subscribers of the Information and Analytical system Globas have the opportunity to get acquainted with the activity of all sole proprietors registered in Russia. In total, the system provides information about more than 4 million active and 11 million inactive sole proprietors.