
Order a report
Custom-made industry research, company ratings, competitor analysis


Current liquidity ratio of the largest Russian manufacturers of medical appliances and equipment
Information agency Credinform presents a ranking of the largest Russian manufacturers of medical appliances and equipment. Companies with the highest volume of revenue (TOP-10) were selected for this ranking according to the data from the Statistical Register for the latest available periods (2016 and 2015). The enterprises were ranked by current liquidity ratio in 2015 (Table 1). The analysis was based on data from the Information and Analytical system Globas.
Current liquidity ratio (х) is calculated as current assets to short-term liabilities of the company. The recommended value is from 1.0 to 2.0. The value of the indicator less than 1.0 indicates the excess of current liabilities over current working capital. Thus, the lower interval limit is determined by the need to ensure the adequacy of working capital for the full repayment of short-term liabilities. Otherwise, the enterprise faces bankruptcy. However, a significant excess of short-term funds over liabilities may indicate a violation of the capital structure and non-rational or inefficient investment of funds.
Taking into account the actual situation both in economy in general and in sectors, the experts of the Information Agency Credinform have developed and implemented in the Information and Analytical System Globas the calculation of practical values of financial ratios that can be recognized as normal for a particular industry. The practical value of current liquidity ratio for manufacturers of medical appliances and equipment in 2016 was from 1,03 to 8,91.
For the most complete and objective view of the financial condition of the enterprise it is necessary to pay attention to the complex of ratios and financial indicators of the company.
| Name, INN, region | Revenue, mln RUB | Net profit, mln RUB | Current liquidity ratio (x) | Solvency index Globas | |||
| 2015 | 2016 | 2015 | 2016 | 2015 | 2016 | ||
| 1 | 2 | 3 | 4 | 5 | 6 | 7 | 8 |
| LLC NEUROSOFT INN 3729002450 Ivanovo region |
519,6 | 758,7 | 151,2 | 182,3 | 29,54 | 48,41 | 167 Superior |
| JSC KRONT-M INN 5047004056 Moscow region |
456,3 | 652,6 | 24,6 | 111,3 | 13,40 | 13,32 | 170 Superior |
| JSC YELATMA INSTRUMENT-MAKING ENTERPRISE INN 6204001412 Ryazan region |
298,2 | 3 202,5 | 652,5 | 531,5 | 5,82 | 8,32 | 179 High |
| JSC THERMO FISHER SCIENTIFIC INN 7805023194 Saint-Petersburg |
881,4 | 1 091,6 | 49,7 | 113,2 | 2,37 | 4,18 | 162 Superior |
| LLC S.P.GELPIK INN 7728220318 Moscow |
751,9 | 835,9 | 130,7 | 128,7 | 3,72 | 3,83 | 145 Superior |
| JSC NIPK ELECTRON INN 7827012767 Saint-Petersburg |
2 312,4 | 1 232,9 | 85,6 | 0,5 | 3,43 | 3,10 | 210 Strong |
| LLC MIASS PLANT FOR MEDICAL EGUIPMENT PRODUCTION INN 7415058730 Chelyabinsk region |
1 239,3 | 1 022,2 | 10,1 | 2,8 | 2,93 | 1,92 | 217 Strong |
| LLC ASK-ROENTGEN INN 7804068234 Saint-Petersburg |
1 062,2 | 1 236,7 | 136,2 | 211,8 | 1,24 | 1,57 | 191 High |
| LLC SEVKAVRENTGEN-D INN 0703006616 The Kabardino-Balkar Republic |
994,6 | 923,9 | 42,7 | 1,5 | 1,08 | 1,20 | 271 Medium |
| LLC TRIVES INN 7803043491 Saint-Petersburg |
676,0 | 726,0 | 5,4 | 14,6 | 1,00 | 0,96 | 208 Strong |
| Total for the group of companies TOP-10 | 9 191,9 | 11 682,9 | 1 288,8 | 1 298,4 | |||
| Average for the group of companies TOP-10 | 919,2 | 1 168,3 | 128,9 | 129,8 | 6,45 | 8,68 | |
| Industry average value | 66,7 | 59,3 | 4,6 | 4,9 | 1,88 | 1,78 | |
The average value of current liquidity ratio of TOP-10 companies in 2016 is higher than practical and average values. Five companies of the TOP-10 have increased indicators of revenue and net profit compared to the previous period. Other companies have decreased their indicators (marked with red filling in columns 3 and 5 of Table 1).
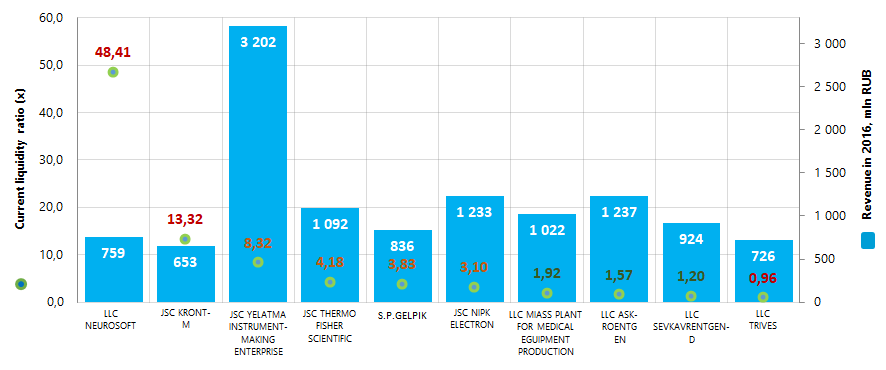 Picture 1. Current liquidity ratio and revenue of the largest Russian manufacturers of medical appliances and equipment (TOP-10)
In general, the average sectoral indicators of current liquidity ratio for the last 10 years were within the interval of recommended values and above practical values of 2016, however, with decreasing tendency (Picture 2).
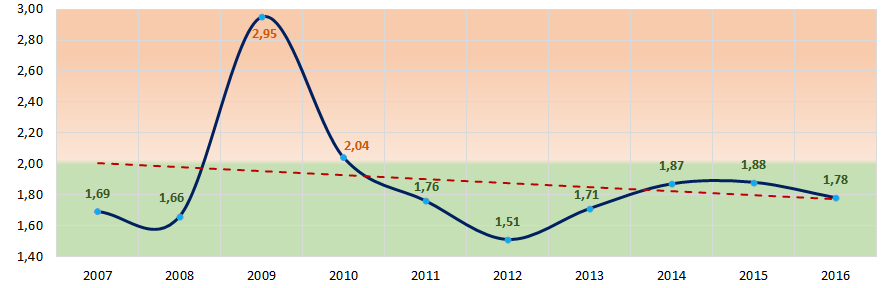 Picture 2. Change of average sectoral values of current liquidity ratio of the largest Russian manufacturers of medical appliances and equipment in 2007 – 2016
All companies of the TOP-10 croup have got from superior to medium solvency index Globas, that shows their ability to repay their debt obligations in time and fully.