TOP-10 Russian betting companies by income for 2018
Information agency Credinform represents the ranking of Russian betting companies by income for 2018. Agency experts, using the Information and Analytical system Globas, selected TOP-10 Russian betting companies by maximum income indicator for 2018, analyzed the net profit and assets of bookmaker's offices. They also estimated the earnings of Russian sport and the State of the RF from the activities of betting organizations.
Bookmaker's offices are legal entities that accept cash bets for various upcoming events with a pre-agreed winning amount. The winning amount is determined by the probability and number of payments. Mainly, bookmakers accept bets for upcoming sports events, for example, football, basketball, hockey etc. With the development of technologies you can make a bet without leaving your home, just having Internet access and choosing a bookmaker's office. In addition, modern technical capabilities allow betting on live1 events. Thus, it is possible to assess the situation in a particular event, and only then place a bet on a specific outcome.
The activity of online bookmakers were banned in Russia until 2015. However, after amendments were made to the Federal Law №244-FZ «On state regulation of the organization and conduct of gambling and on amendments to some legislative acts of the RF», bookmaker's offices in the RF were legalized, with the exception of special gaming zones. The evidence of legal activity is a special license, giving the right to carry out and conduct gambling and bet on various sports events. In the absence of a permit for the activity, the bookmaker's office automatically falls into the category of prohibited organizations.
In March 2017, the President of the RF V.V. Putin signed a law, regulating the financial activities of bookmakers. Amendments were made to the Federal Law №244 «On state regulation of gambling». Article 6.2. «Purpose-oriented allocations from gambling made by the organizer of gambling in the bookmaker's office» allowed bookmaker's offices to conclude officially sponsorship contracts with sports clubs of Russia, to finance tournaments and various sports events. Each betting organization got the opportunity to advertise itself and promote its brand in the media, on federal television channels and the Internet. In return, betting companies should direct 5% of their income in the form of investment for the development of domestic sport. Thus, the income growth of all betting organizations for one financial year amounted to 100, 200, 300 and even 1000%.
| Rank | Name | Income in 2018, billion rubles | Growth (decrease) by 2017, in % | Net profit, billion rubles | Assets, billion rubles |
| 1 | BC Liga Stavok Moscow |
36,2 |  202,4 202,4 |
0,6 | 2,3 |
| 2 | BC FONBET Moscow |
24,8 |  154,6 154,6 |
9,3 | 6,1 |
| 3 | BC Bingo Boom Moscow |
20,2 |  136,2 136,2 |
0,4 | 1,9 |
| 4 | BC BETCITY Rostov-on-Don |
17,3 |  -4,3 -4,3 |
0,5 | 1,6 |
| 5 | BC BALTBET Saint-Petersburg |
12,3 |  13,6 13,6 |
0,3 | 1,7 |
| 6 | BC WINLINE Moscow |
10,9 |  339,7 339,7 |
0,7 | 1,1 |
| 7 | 1xStavka Bryansk |
8,9 |  146,6 146,6 |
4,7 | 7,6 |
| 8 | BC LEON Moscow |
2,3 |  246,8 246,8 |
0,2 | 1,4 |
| 9 | BC OLIMP Moscow |
1,8 |  681,3 681,3 |
0,1 | 1,4 |
| 10 | BC Marafon Bet Moscow |
0,9 |  1908,0 1908,0 |
0,1 | 0,3 |
| TOP-10 betting companies | 135,5 |  104,8 104,8 |
16,9 | 25,4 | |
Source: Information and Analytical system Globas
The first place in the ranking is taken by the bookmaker's office «Liga Stavok» with the highest income for 2018 (36.2 billion rubles). According to experts of the Information agency Credinform, tax deductions for 2018 will amount to 458.2 million rubles. «Liga Stavok» is the general partner of the Russian Premier League (RPL2 ). The contract amount is estimated at 500 million rubles and many times exceeds the contract of the previous general sponsor of the Russian Premier League – the insurance company Rosgosstrakh. The bookmaker's office «Liga Stavok» invested 1.8 billion rubles in Russian sports at the end of 2018. Such volume of attracted capital makes the betting company a leader among investors of domestic sports.
The second place belongs to the bookmaker's office FONBET. Its income amounted to 24.8 billion rubles. At the beginning of the season 2018/19 FONBET signed an exclusive contract with the Continental Hockey League (KHL) and acts there as official sponsor in it. In addition, the company sponsors FNL3 and PFL4. Initially, FONBET was supposed to become the general sponsor of RPL, but due to a number of disagreements, it failed to agree. According to experts of the Information agency Credinform, the tax deductions of FONBET to the budget of the RF are the largest: in 2018 their amount was 701.6 million rubles. The company also takes the second place in terms of investment in Russian sports (1.2 billion rubles). There is no equal company in terms of net profit.
In terms of income, the bookmaker's office Bingo Boom takes the third line in the ranking (20.2 billion rubles). Its tax deductions, according to experts of Credinform, will yield the State 103.3 million rubles for 2018, and the amount of investment in the sport industry amounted to slightly more than 1 billion rubles.
The company BETCITY was able to earn 17.3 billion rubles. Immediately after the entry into force of the Law «On purpose-oriented allocations from gambling» BETCITY has entered into a partnership agreement with the football club PFC CSKA for 5 years. Details of the sponsorship contract were not disclosed, but with the help of the funds received «CSKA» were able to strengthen quite well before the start of the season 2018/2019. According to experts of Credinform, the tax deductions for 2018 amounted to 100 million rubles, and the amount of investments was 865 million rubles.
The fifth line of the ranking belongs to the bookmaker's office BALTBET. Until 2018, the company acted as the general sponsor of the football club Tosno. By the end of the season 2017/18 Tosno FC has been declared bankrupt and is currently in the liquidation. According to experts of Credinform, the Russian budget received from this company 152.6 million rubles from taxes on gambling in 2018, and the amount of capital raised exceeded 600 million rubles.
The income of the bookmaker's office Winline allowed it to occupy the 6th line of our TOP list (10.9 billion rubles). Winline is the main sponsor of Spartak FC. The organization logo is placed on the football uniform on the right shoulder. Winline was the first organization, which has begun cooperating with football clubs in Russia. Thanks to the bookmaker's office Winline, domestic sports were able to get 545 million rubles for development, and, according to experts of Credinform, the state treasury has increased by 128.4 million.
«1xStavka» is a subsidiary of «1xBet». By media level, it is the most recognizable bookmaker’s office in Russia. «1xStavka» companies entered into exclusive contracts in Russian sports. The partnership agreements were reached with Zenit FC, Lokomotiv FC and Krasnodar FC. The leaders of the Russian football championship made the brand «1xStavka» the most recognizable and discussed among the population. The bookmaker’s office «1xBet» continues to work in the direction of sponsorship contracts and has already reached the agreements with global top clubs, such as: Barcelona FC and English football club Tottenham. Data on the amount of taxes paid in Russia are not available. The level of investment in Russian sports exceeds 445 million rubles.
The bookmakers' income rating is closed by bookmaker’s office LEON, bookmaker’s office OLIMP) and «Marafon Bet». According to experts of Credinform, the total amount of tax deductions reached 174.1 million rubles. Note that the bookmaker’s office OLIMP is the general sponsor of the Russian Super Cup. The tournament where the winner of the Cup of the country and the current Champion of the country meet. The total investment from three organizations amounted to 250 million rubles.
The results of the ranking showed that thanks to the bookmaker’s offices the Russian state received 1.8 billion rubles in the form of tax deductions, and 6.7 billion rubles were directed for the development of domestic sports. However, the main cash flows were concentrated among the best Russian sport clubs, which were commercially profitable for bookmakers, and the development of regional sports was again frozen. It is necessary to regulate investment flows, otherwise the development policy of domestic sports will fail.
1 Live event –event held at a real time
2 RPL - professional football league, top division in the Russian football league system
3 National Football League (FNL) - professional football league, Russia's second most powerful football league
4 PFL - professional football league, Russia's third most powerful football league
Activity trends in pharmaceuticals production
Information agency Credinform has observed trends in the activity of the largest Russian manufacturers of pharmaceuticals and medical products.
Enterprises with the largest volume of annual revenue (TOP-10 and TOP-1000) were selected for the analysis, according to the data from the Statistical Register for the latest available periods (for 2015-2017). The analysis was made on the basis of the data of the Information and Analytical system Globas.
Net assets is an indicator, reflecting the real value of company's property, is calculated annually as the difference between assets on the enterprise balance and its debt obligations. The indicator of net assets is considered negative (insufficiency of property), if company’s debt exceeds the value of its property.
The largest company in terms of net assets amount is JSC PHARMSTANDART-LEKSREDSTVA. In 2018 net assets of the company amounted to more than 3,1 billion RUB.
JSC F-SYNTHESIS had the smallest amount of net assets in the TOP-1000 group. Insufficiency of property of the company in 2018 was expressed in negative value -2,2 billion RUB.
For a ten-year period average amount of net assets of TOP-1000 companies has increasing tendency (Picture 1).
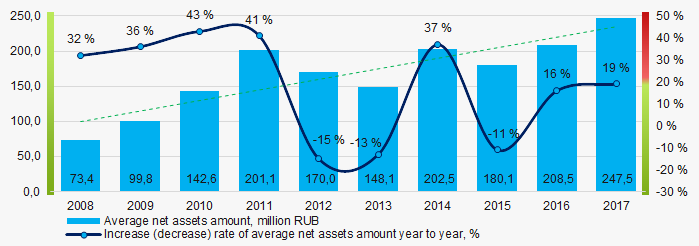 Picture 1. Change in average indicators of the net asset amount of manufacturers of pharmaceuticals and medical products in 2008 – 2017
Share of companies with insufficiency of property in the TOP-1000 demonstrate increasing tendency for the last five years (Picture 2).
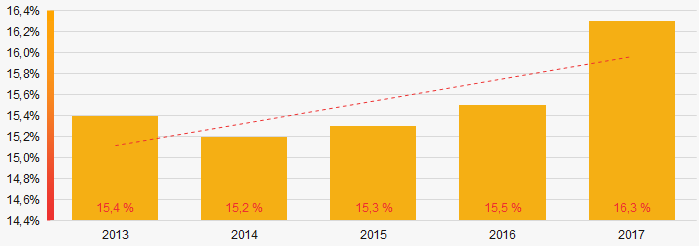 Picture 2. . Shares of companies with negative values of net assets in TOP-1000 companies in 2013 – 2017
Sales revenue
The revenue volume of 10 leaders of the industry made 35% of the total revenue of TOP-1000 companies in 2017 (Picture 3). It demonstrates relatively high level of competition in the industry.
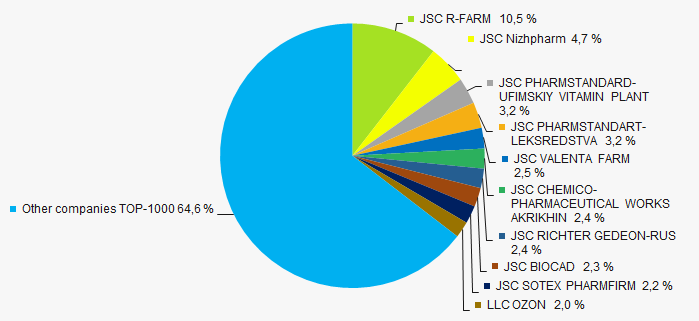 Picture 3. Shares of participation of TOP-10 companies in the total revenue of TOP-1000 companies for 2017
In general, over a ten-year period an increasing tendency in revenue volume is observed (Picture 4).
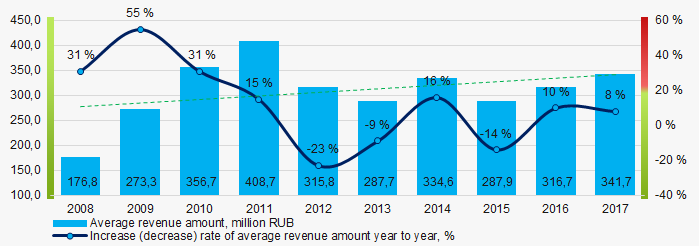 Picture 4. . Change in the average revenue of manufacturers of pharmaceuticals and medical products in 2008 – 2017
Profit and losses
The largest company in terms of net profit amount is JSC VALENTA FARM . Net profit of the company amounted to more than 4,7 billion RUB for 2018.
For the last ten years average industrial indicators of net profit have an increasing tendency (Picture 5).
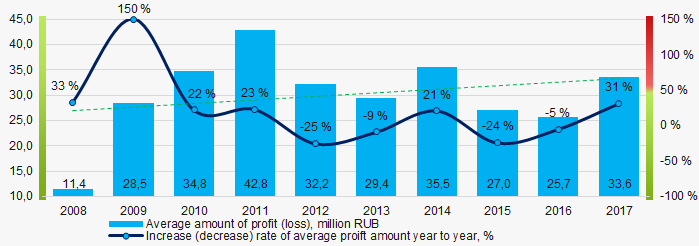 Picture 5. Change in the average indicators of net profit of manufacturers of pharmaceuticals and medical products in 2008 – 2017
Over a five-year period, the average values of net profit indicators of TOP-1000 companies tend to increase. Besides, the average value of net loss increases (Picture 6).
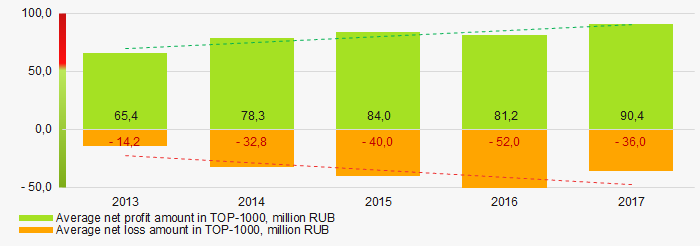 Picture 6.Change in the average indicators of net profit and loss of TOP-1000 companies in 2015 – 2017
Key financial ratios
Over the ten-year period the average indicators of the current liquidity ratio in general were within the range of recommended values – from 1,0 up to 2,0 with increasing tendency (Picture 7).
The current liquidity ratio (the relation of the amount of current assets to short-term liabilities) shows the sufficiency of company’s funds for repayment of its short-term liabilities.
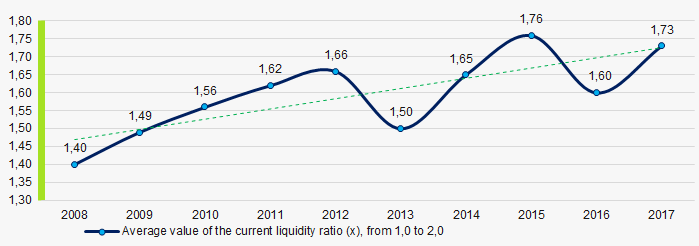 Picture 7. Change in the average values of the current liquidity ratio of manufacturers of pharmaceuticals and medical products in 2008 – 2017
Average values of the indicators of the return on investment ratio have decreasing tendency for ten years (Picture 8).
The ratio is calculated as the relation of net profit to the sum of own capital and long-term liabilities and demonstrates the return on the equity involved in the commercial activity of own capital and the long-term borrowed funds of an organization.
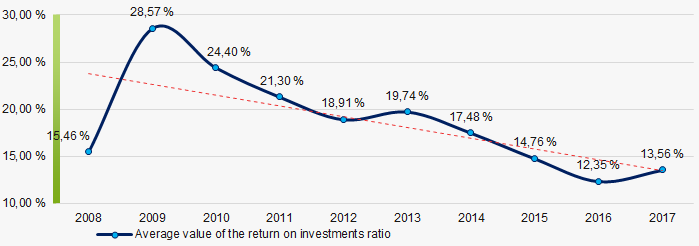 Picture 8. Change in the average values of the return on investment ratio of manufacturers of pharmaceuticals and medical products in 2008 – 2017
Asset turnover ratio is calculated as the relation of sales revenue to the average value of total assets for a period and characterizes the efficiency of use of all available resources, regardless of the sources of their attraction. The ratio shows how many times a year a complete cycle of production and circulation is made, yielding profit.
This business activity ratio showed a tendency to decrease for a ten-year period (Picture 9).
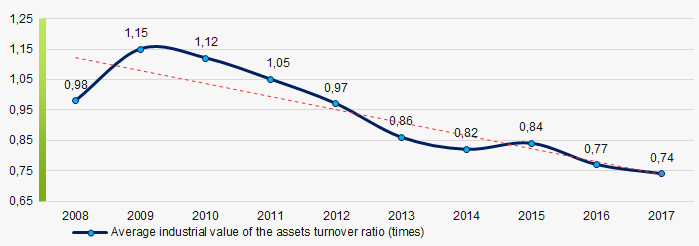 Picture 9. Change in the average values of the assets turnover ratio of manufacturers of pharmaceuticals and medical products in 2008 – 2017
Small business
76% of the TOP-1000 companies are registered in the Register of small and medium enterprises of the Federal Tax Service of the RF. Besides, share of revenue in the total volume in 2017 is 11,6%, that is twice as low as the average indicator countrywide (Picture 10).
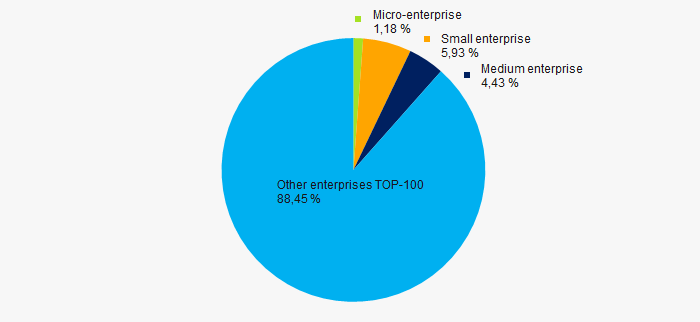 Picture 10. Shares of small and medium enterprises in TOP-1000 companies, %
Main regions of activity
TOP-1000 enterprises are unequally distributed along the territory of Russia and registered in 65 regions. Almost 52% of revenue volume is concentrated in Moscow and Moscow region (Picture 11).
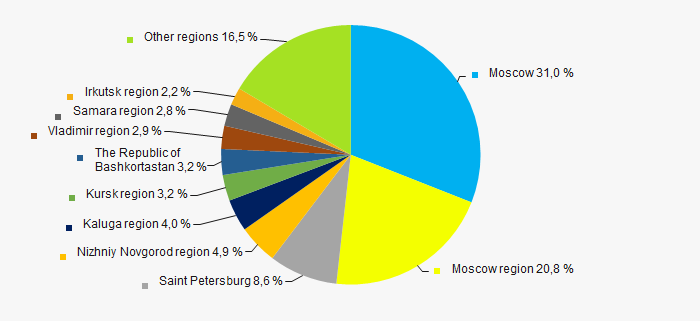 Picture 11. Distribution of TOP-1000 companies by regions of Russia
Financial position score
An assessment of the financial position of TOP-1000 companies shows that the largest number is in an average financial position. (Picture 12).
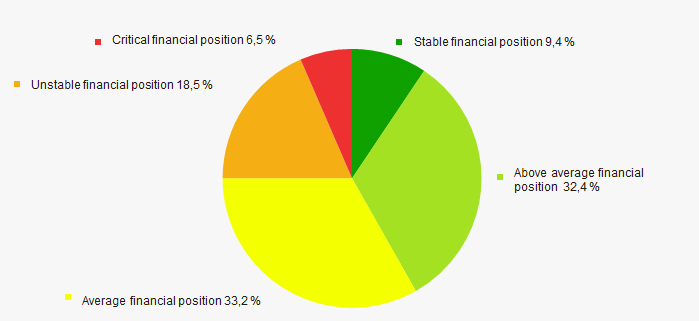 Picture 12. Distribution of TOP-1000 companies by financial position score
Solvency index Globas
Most of TOP-1000 companies have got from Medium to Superior Solvency index Globas, that points to their ability to repay their debts in time and fully (Picture 13).
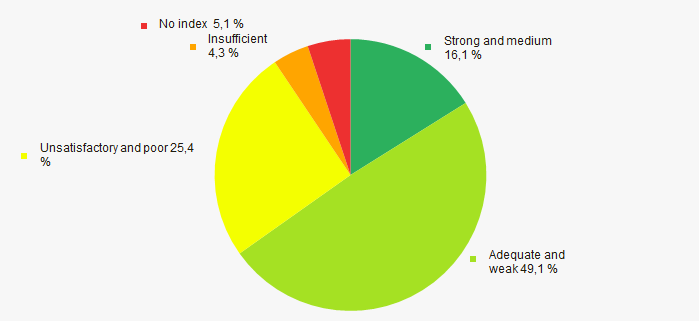 Picture 13.Distribution of TOP-1000 companies by solvency index Globas
Industrial production index
According to the data of the Federal State Statistics Service, increasing trend in indicators of the industrial production index is observed in the sphere of manufacture of pharmaceuticals and medical products in 2018 – 2019 (Picture 14). Besides, the average indicator from month to month amounted to 102,3%.
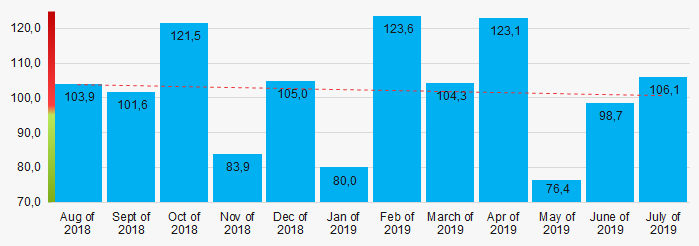 Picture 14. Production indexes in 2018 – 2019, (%)
According to the same data, share of the companies, engaged manufacture of pharmaceuticals and medical products in the volume of revenue from sale of goods, products, works and services countrywide in general amounted to 0,001% for 2018.
Conclusion
Comprehensive assessment of the activity of largest Russian manufacturers of pharmaceuticals and medical products, taking into account the main indexes, financial indicators and ratios, demonstrates the presence of favorable trends (Table 1).
| Trends and assessment factors | Share of factor, % |
| Rate of increase (decrease) of average amount of net assets |  10 10 |
| Increase / decrease of share of companies with negative values of net assets |  -10 -10 |
| Level of competition |  5 5 |
| Increase (decrease) rate of average revenue amount |  10 10 |
| Increase (decrease) rate of average net profit (loss) amount |  10 10 |
| Increase / decrease of average net profit amount of TOP-1000 companies |  10 10 |
| Increase / decrease of average net loss amount of TOP-1000 companies |  -10 -10 |
| Increase / decrease of average industrial values of the current liquidity ratio |  10 10 |
| Increase / decrease of average industrial values of the return on investments ratio |  -10 -10 |
| Increase / decrease of average industrial values of the assets turnover ratio, times |  -5 -5 |
| Share of small and medium enterprises in the industry in terms of revenue volume more than 22% |  -10 -10 |
| Regional concentration |  -10 -10 |
| Financial position (major share) |  5 5 |
| Solvency index Globas (major share) |  10 10 |
| Industrial production index |  -5 -5 |
| Average value of factors |  0,7 0,7 |
 positive trend (factor) ,
  negative trend (factor).