
Order a report
Custom-made industry research, company ratings, competitor analysis


Solvency ratio of the largest Russian companies engaged in processing and conservation of fish, crustaceans and mollusks
Information agency Credinform has prepared a ranking of the largest Russian companies engaged in processing and conservation of fish, crustaceans and mollusks. The largest enterprises (TOP-10) in terms of annual revenue were selected according to the data from the Statistical Register for the available periods (from 2014 to 2016). Then the companies were ranged by solvency ratio (Table 1). The analysis was based on the data from the Information and Analytical system Globas.
Solvency ratio (x) is calculated as a ratio of shareholders’ equity to total assets and shows the dependence of the company on external loans. The recommended value of the ratio is >0,5. The ratio value less than minimum limit signifies about strong dependence on external sources of funds; such dependence may lead to liquidity crisis, unstable financial position in case of economic downturn.
The calculation of practical values of financial indicators, which might be considered as normal for a certain industry, has been developed and implemented in the Information and Analytical system Globas by the experts of the Information Agency Credinform, taking into account the actual situation of the economy as a whole and the industries.
In 2016 the practical value of solvency ratio for companies engaged in processing and conservation of fish, crustaceans and mollusks is from 0,01 to 0,83.
For the most full and fair opinion about the company’s financial position the whole set of financial indicators and ratios should be taken into account.
| Name, INN, region | Revenue, mln RUB | Net profit, mln RUB | Solvency ratio (x) | Solvency index Globas | |||
| 2015 | 2016 | 2015 | 2016 | 2015 | 2016 | ||
| USTKAMCHATRYBA CO., LTD INN 4109002780 Kamchatka Krai |
|
|
|
|
|
|
174 Superior |
| NAO KURILSKII RYBAK INN 6511000178 Sakhalin region |
|
|
|
|
|
|
155 Superior |
| PAO OZERNOVSKII RKZ #55 INN 4108003484 Kamchatka Krai |
|
|
|
|
|
|
158 Superior |
| NAO SEVERO-KURILSKAYA BAZA SEINERNOGO FLOTA INN 6515000242 Sakhalin region |
|
|
|
|
|
|
141 Superior |
| Federal state unitary enterprise ARKHANGELSKOE of the Federal Service for the Execution of Sanctions INN 3621005430 Saint-Peterburg In process of reorganization in the form of transformation, 21.05.2018 |
|
|
|
|
|
|
229 Strong |
| LLC Vichunai RUS INN 3911008930 Kaliningrad region |
|
|
|
|
|
|
199 High |
| PAO MERIDIAN INN 7713016180 Moscow |
|
|
|
|
|
|
206 Strong |
| PAO RYBOOBRABATYVAYUSHCHII KOMBINAT #1 INN 7805024462 Saint-Peterburg |
|
|
|
|
|
|
184 High |
| NAO RUSSIAN SEA INN 5031033020 Moscow region |
|
|
|
|
|
|
226 Strong |
| NAO BALTIC COAST INN 7826059025 Leningrad region Process of being wound up, 03.05.2017 |
|
|
|
|
|
|
600 Insufficient |
| Total for TOP-10 companies | |
|
|
|
|||
| Average value for TOP-10 companies | |
|
|
|
|
|
|
| Average industry value | |
|
|
|
|
|
|
![]() — growth of indicator in comparison with prior period,
— growth of indicator in comparison with prior period, ![]() — decline of indicator in comparison with prior period.
— decline of indicator in comparison with prior period.
Average value of solvency ratio for TOP-10 companies is lower than recommended value and higher than average industry value.
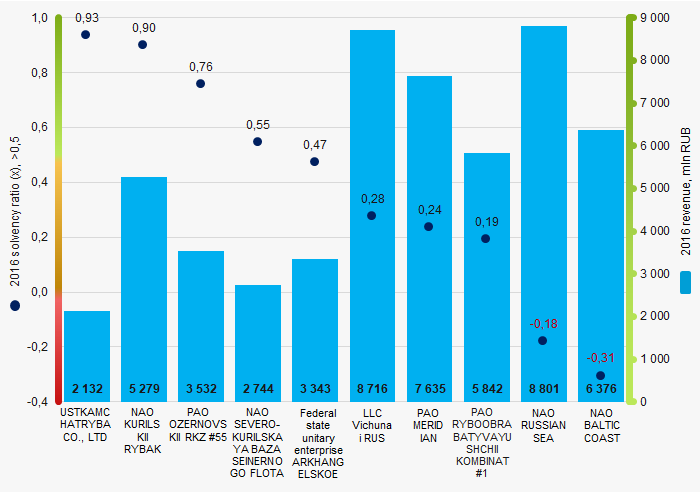 Picture 1. Solvency ratio and revenue of the largest Russian companies engaged in processing and conservation of fish, crustaceans and mollusks (ТОP-10)
For the last 10 years, the average values of solvency ratio showed the increasing tendency (Picture 2).
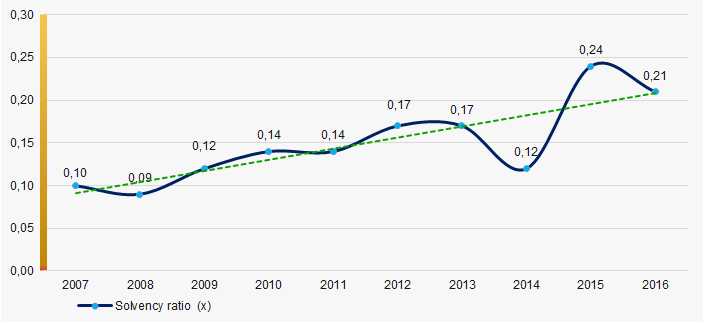 Picture 2. Change in average industry values of solvency ratio of the largest Russian companies engaged in processing and conservation of fish, crustaceans and mollusks in 2007 — 2016