Top-10 Kontinental Hokey League clubs
At the height of the 2019 Ice Hockey World Championship in Slovakia, the Information agency Credinform presents a ranking of the Kontinental Hockey League (KHL) clubs by total assets. Using the Information and Analytical System Globas, the experts of the Agency selected Top-10 of the KHL teams with the largest amount of assets. To get the total value of the assets of the club, the salary projects of the players was taken into account. It was also analyzed which of the KHL clubs is the main supplier of players for the national team.
The Kontinental Hockey League is an open international hockey league that unites clubs from Russia, Belarus, Kazakhstan, China, Latvia, Slovakia and Finland. The first KHL championship was held in the 2008/09 season. KHL is the most prestigious and first in strength division of professional hockey in Russia. The main trophy of the League is the Gagarin Cup1.
Unlike football, hockey player’s value is determined by his contract, i.e. the amount that a sports organization spends on paying salaries to a hockey player while he plays for a club.
Transitions of players between clubs are possible only with the full consent of the player. Moreover, the receiving party fully redeems the salary contract from the previous club. Financial conditions for each hockey player are individual and depend on many factors, so the process of such a transition is very difficult. Most often, the transition to other teams is carried out in the status of a free agent, i.e. when the contract expired and all obligations of the player to the club are fully fulfilled.
| Rank | Name | Balance sheet assets, billion RUB | Salary project, billion RUB | Total assets value, billion RUB | The most valuable player |
| 1 | PHC CSKA Moscow |
11.20 | 2.17 | 13.37 | Aleksei Marchenko (125 million RUB per year) |
| 2 | HC SKA Saint Petersburg |
4.66 | 2.11 | 6.77 | Pavel Datsyuk (170 million RUB per year) |
| 3 | AK Bars Kazan |
3.42 | 1.73 | 5.15 | Danis Zaripov (130 million RUB per year) |
| 4 | HC Avangard Omsk |
1.55 | 1.61 | 3.16 | Cody Franson (90 million RUB per year) |
| 5 | HC Salavat Yulaev Ufa |
1.36 | 1.48 | 2.84 | Linus Omark (150 million RUB per year) |
| 6 | HC Metallurg Mg Magnitogorsk |
0.80 | 1.78 | 2.58 | Sergei Mozyakin (180 million RUB per year) |
| 7 | HC Dynamo M Moscow |
0.91 | 1.11 | 2.02 | Vadim Schipachev (120 million RUB per year) |
| 8 | HC Lokomotiv Yaroslavl |
0.48 | 1.06 | 1.54 | Brandon Kozun (80 million RUB per year) |
| 9 | HC Vityaz Podolsk |
0.49 | 0.86 | 1.35 | Juuso Puustinen (information is not disclosed) |
| 10 | HC Neftekhimik Nizhnekamsk |
0.83 | 0.51 | 1.34 | Alexander Semin (information is not disclosed) |
Source:Information and Analytical System Globas by Credinform, data from Sport-express and official KHL website.
PHC CSKA with the highest balance sheet assets (11,20 billion RUB) and the salary project amount (2.17 billion rubles) is ranked the first. Having many trophies of the USSR championships, CSKA is the most titled club in the history of national and world hockey. However, for all the time of performance in the KHL, the team won the Gagarin Cup only once. There was such a memorable event in the current season 2018/19. The most valuable player of the club is Alexei Marchenko, the defender and Olympic champion of the 2018 games. The player is also included in the Top-10 of the highest-paid KHL players. Moreover, CSKA is the base club for the Russian national hockey team. At the World Championship 2019 in Slovakia, 6 players of this team were summoned at once.
The second is HC SKA from Saint Petersburg. Despite the club has 2,5 times less total assets (4,66 billion RUB) than the leader of the ranking, it is not far behind in terms of the salary project (2,11 billion RUB). Over the entire period of the KHL's performances, HC SKA became the two-time winner of the Gagarin Cup and won many other significant trophies. The most valuable player is Pavel Datsyuk, the center forward and the captain of the team. Olympic champion of the games in 2018, he played in the NHL2 for 16 years and won the Stanley Cup3. However, the attacker was not summoned to Slovakia. Nevertheless, 3 players were called to the 2019 World Championship from HC SKA. A year earlier, in the winter games of 2018, 15 athletes from the Saint Petersburg team were represented in the Russian team.
AK Bars won the KHL trophy for three times. By victories, the club from Tatarstan is the sole leader. Danis Zaripov, the captain of the team, is the most titled, and therefore the most valuable player: a three-time World Champion, five-time winner of the Gagarin Cup. Due to its sporting success, the total asset value of the club is 5,15 billion RUB.
The most valuable player of the whole League is Sergey Mozyakin, the winger of Magnitogorsk Metallurg and Olympic champion of the games of 2018. The club twice in its history became the winner of the Gagarin Cup. One of the most successful Russian hockey players, Evgeny Malkin, the NHL star and a three-time Stanley Cup winner, is the trainee of the club from Magnitogorsk.
The most famous and successful Russian hockey player, a member of the national team at the World Championships 2019, Alexander Ovechkin was trained by Dynamo Moscow hockey club. In the 2012/13 season, during the game break (lockout) in the NHL4, Ovechkin helped his home club win the main Cup of the Kontinental League for the second time running. However, after that, the team never played in the final playoffs, losing the tournament in earlier stages.
Lokomotiv from Yaroslavl with total asset value of 1,54 billion RUB is ranked the 8th. September 7, 2011 near Yaroslavl, there was a terrible tragedy that shook not only Russia, but the whole world. The main team of the hockey club died in a plane crash. The players were supposed to arrive at their starting game of the 2011/12 season in Minsk. In the 2011/12 season, Lokomotiv did not play in the KHL, and together with his youth team, which later became the main one, took part in the Supreme Hockey League5. However, after only a year, the team returned to the KHL and reached the playoffs of the Gagarin Cup.
It is noteworthy that only one of the top 10 KHL clubs is privately owned. HC Neftekhimik through a chain of organizations belongs to theTaif JSC group of companies. The owner of the group is a Russian entrepreneur Radik Mintimerovich Shaimiev.
The three hockey teams are non-profit organizations: HC Vityaz, Metallurg, HC Salavat Yulaev.
The ultimate owners of the remaining teams are the state structures that own hockey clubs through the largest corporations. So, HC SKA and HC Avangard are controlled by the Russian government through JSC Gazprom; HC Lokomotiv through Russian Railways JSC; PFC CSKA and AK Bars through major domestic oil companies: Rosneft and Tatneft. Like the football club of the same name, Moscow Dynamo is owned by the power structures of Russia.
The ranking results showed that, unlike football, the Top-10 KHL teams are clubs, having achieved serious sports success. All presented hockey teams are regular participants, finalists and winners of the playoff draw. Six out of ten Top teams are Gagarin Cup winners and multiple national champions. Hockey can justly be considered as one of the most spectacular and interesting sports, where victories and successes are achieved only with the Team.
1 The Gagarin Cup is the main hockey prize of the Kontinental Hockey League, awarded to the winner of the KHL playoffs series; the equivalent of the Stanley Cup in the NHL.
2 The National Hockey League (NHL) is a professional sports organization that unites the hockey clubs of the USA and Canada, the most prestigious hockey league in the world.
3 The Stanley Cup is the main hockey prize of the National Hockey League, awarded to the winner of the NHL playoff series; the equivalent of the Gagarin Cup in the KHL.
4 Players and club owners could not reach an agreement on salaries and bonuses, which led to the postponement of the season.
5 The Supreme Hockey League (VHL) is an open international hockey league, which is also the second most powerful division of professional hockey in Russia after the KHL.
Trends in footwear manufacturing
Information agency Credinform has observed trends in the activity of the largest Russian footwear manufacturers.
Enterprises with the largest volume of annual revenue (TOP-10 and TOP-500), were selected for the analysis, according to the data from the Statistical Register for the latest available periods (for 2015-2017). The analysis was made on the basis of the data of the Information and Analytical system Globas.
Net assets - indicator, reflecting the real value of company's property, is calculated annually as the difference between assets on the enterprise balance and its debt obligations. The indicator of net assets is considered negative (insufficiency of property), if company’s debt exceeds the value of its property.
For ten years average amounts of net assets of TOP-500 companies have increasing tendency (Picture 1).
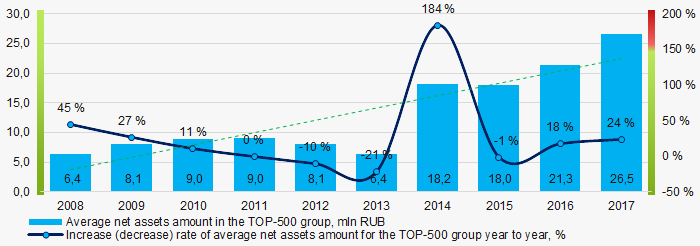 Picture 1. Change in TOP-500 average indicators of the net assets amount of footwear manufacturers in 2008 – 2017
Share of companies with insufficiency of property among TOP-500 for the last three years is relatively high and tends to decrease (Picture 2).
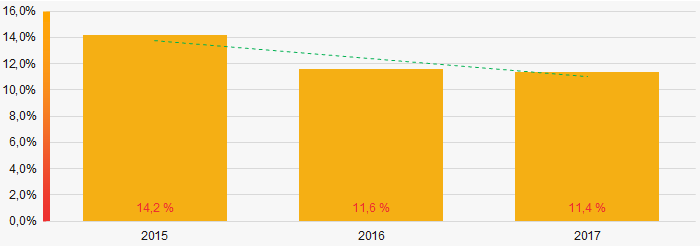 Picture 2. Share of companies with negative value of net assets amount in TOP-500 in 2015 – 2017
 Sales revenue
The revenue of 10 leaders of the industry made 45% of the total revenue of TOP-500 companies in 2017(Picture 3). It demonstrates high level of monopolization in the industry.
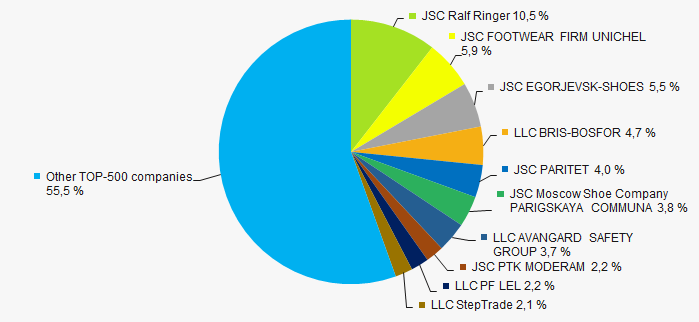 Picture 3. Shares of participation of TOP-10 companies in the total revenue of TOP-500 companies for 2017
In general, over a ten-year period an increase of indicators of average revenue volume is observed (Picture 4).
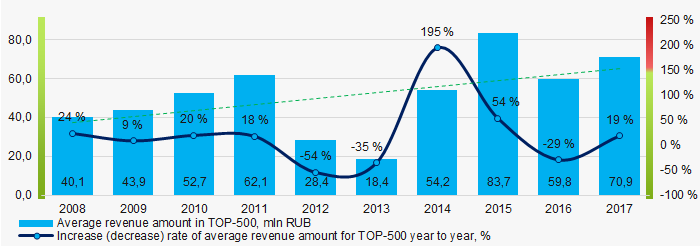 Picture 4. Change in the average revenue of footwear manufacturers in 2008 – 2017
 Profit and losses
For ten years average indicators of net profit have increasing tendency (Picture 5).
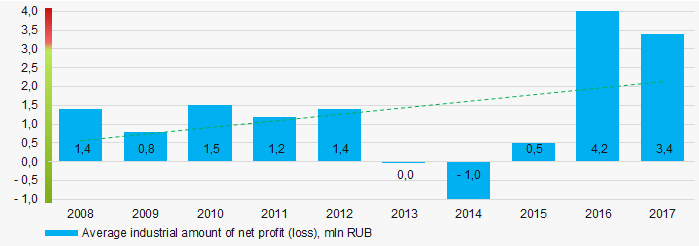 Picture 5. Change in the average values of net profit of footwear manufacturers in 2008 – 2017
 Over a three-year period, the average values of profit indicators of TOP-500 companies tend to increase. Besides, average value of net loss is decreasing (Picture 6).
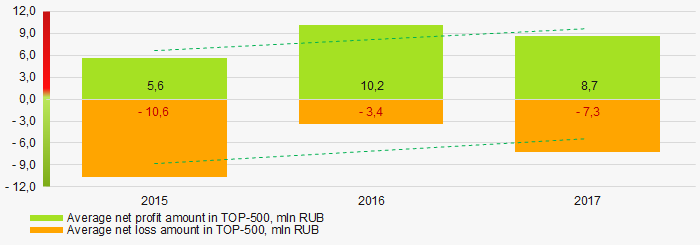 Picture 6. Change in the average indicators of profit and loss of TOP-500 companies in 2015 – 2017
 Key financial ratios
Over the ten-year period the average indicators of the current liquidity ratio were above the range of recommended values – from 1,0 up to 2,0 with increasing tendency (Picture 7).
The current liquidity ratio (the relation of the amount of current assets to short-term liabilities) shows the sufficiency of company’s funds for repayment of its short-term liabilities
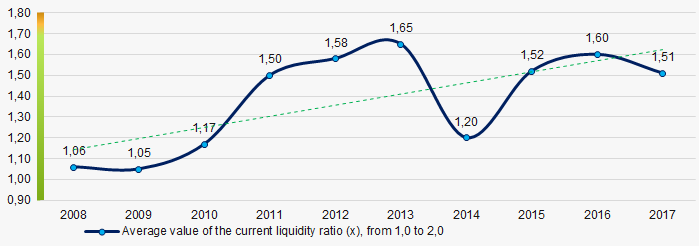 Picture 7. Change in the industry values of the current liquidity ratio of footwear manufacturers in 2008 – 2017
 Relatively high level of the average indicators of the return on investments ratio with decreasing tendency has been observed for ten years. (Picture 8).
The ratio is calculated as the relation of net profit to the sum of own capital and long-term liabilities and demonstrates the return on the equity involved in the commercial activity of own capital and the long-term borrowed funds of an organization.
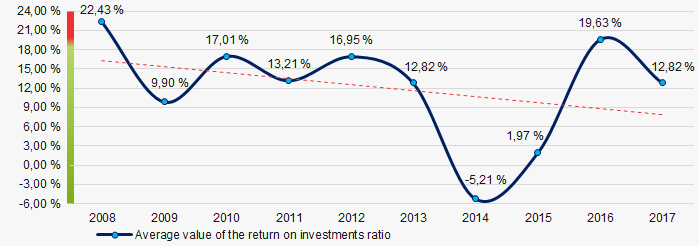 Picture 8. Change in the average values of the return on investments ratio of footwear manufacturers in 2008 – 2017
Asset turnover ratio is calculated as the relation of sales revenue to the average value of total assets for a period and characterizes the efficiency of use of all available resources, regardless of the sources of their attraction. The ratio shows how many times a year a complete cycle of production and circulation is made, yielding profit.
This business activity ratio showed a tendency to decrease for ten-year period (Picture 9).
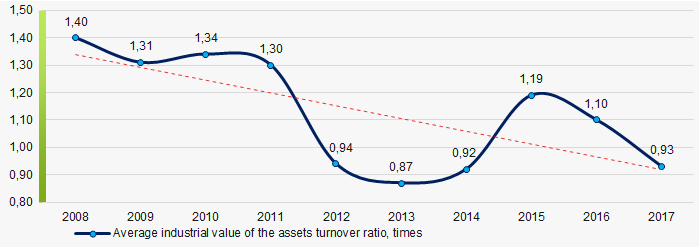 Picture 9. Change in the average values of the asset turnover ratio of footwear manufacturers in 2008 – 2017
 Small business
91% of TOP-500 companies are registered in the Register of small and medium enterprises of the Federal Tax Service of the RF. Besides, share of the companies in the total revenue of TOP-500 amounts to 46% in 2017, that significantly exceeds average indicator for the country (Picture 10).
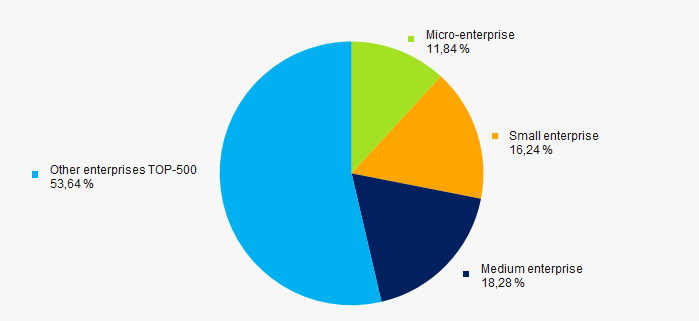 Picture 10. Shares of small and medium enterprises in TOP-500 companies, %
Main regions of activities
TOP-500 companies are unequally distributed on the territory of Russia and registered in 64 regions. The largest companies in terms of revenue volume are concentrated in Moscow and Moscow region (Picture 11).
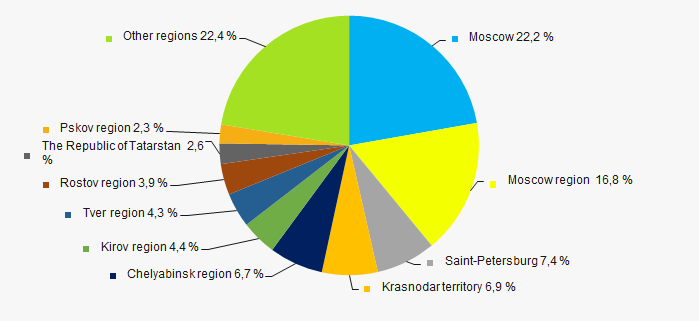 Picture 11. Distribution of revenue of TOP-500 companies by regions of Russia
 Financial position score
An assessment of the financial position of TOP-500 companies shows that major part of companies are in an average financial position (Picture 12).
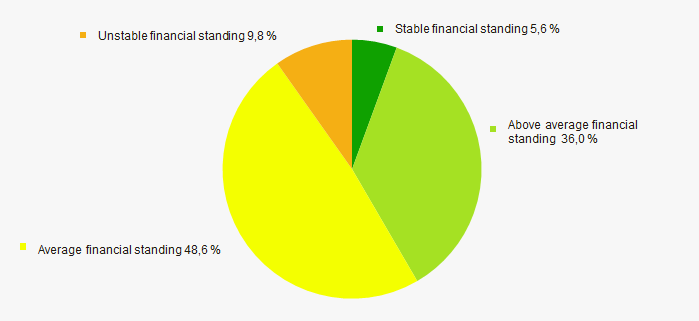 Picture 12. Distribution of TOP-500 companies by financial position score
Solvency index Globas
Most of TOP-500 companies have got from Medium to Superior Solvency index Globas, that points to their ability to repay their debts to the full extent (Picture 13).
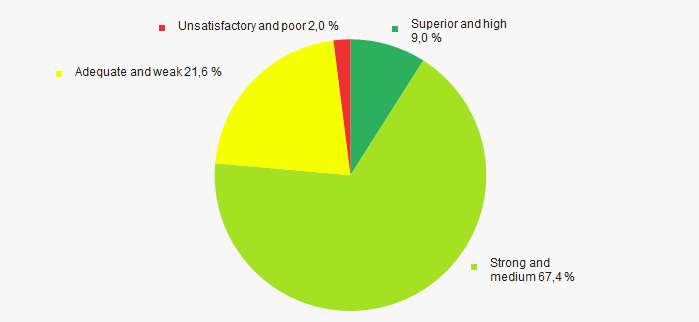 Picture 13. Distribution of TOP-500 companies by solvency index Globas
Industrial production index
According to the data from the Federal State Statistics Service, during 2018 – 2019 increasing tendency for the industrial production index of manufacture of footwear is observed (Picture 14).
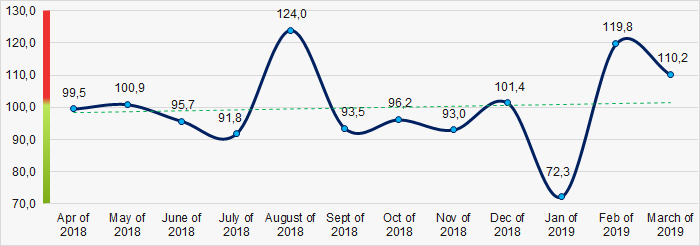 Picture 14. Industrial production index of manufacture of footwear in 2018 – 2019, (%)
According to the same data, share of footwear manufacturers in the total revenue volume from sale of goods, products, works and services for the country was 0,02% in 2018.
Conclusion
Comprehensive assessment of the activity of largest footwear manufacturers, taking into account the main indexes, financial indicators and ratios, demonstrates the presence of favorable trends (Table 1).
| Trends and assessment factors | Share of factor, % |
| Rate of increase (decrease) of average amount of net assets |  10 10 |
| Increase / decrease of share of companies with negative values of net assets |  5 5 |
| Increase (decrease) rate of average revenue amount |  10 10 |
| Rate of competition / monopolization |  -10 -10 |
| Increase (decrease) rate of average net profit (loss) amount |  10 10 |
| Increase / decrease of average net profit amount of TOP-1000 companies |  10 10 |
| Increase / decrease of average net loss amount of TOP-1000 companies |  10 10 |
| Increase / decrease of average industrial values of the current liquidity ratio |  10 10 |
| Increase / decrease of average industrial values of the return on investments ratio |  -5 -5 |
| Increase / decrease of average industrial values of the assets turnover ratio, times |  -10 -10 |
| Share of small and medium enterprises in the industry in terms of revenue volume more than 22% |  10 10 |
| Regional concentration |  -10 -10 |
| Financial position (major share) |  5 5 |
| Solvency index Globas (major share) |  10 10 |
| Industrial production index |  5 5 |
| Average value of factors |  4,0 4,0 |
 — positive trend (factor),
  — negative trend (factor).