
Order a report
Custom-made industry research, company ratings, competitor analysis


Foreign loans in software engineering
Information agency Credinform represents the ranking of the largest Russian software developers. The companies with the largest volume of annual revenue (TOP-10) were selected for the ranking, according to the data from the Statistical Register for the latest available periods (for 2015 - 2017). Then they were ranked by solvency ratio (Table 1). The analysis was made on the basis of the data of the Information and Analytical system Globas.
Solvency ratio (х) is calculated as the relation of the amount of equity to balance sum and characterizes company's dependence on foreign loans. Recommended value is: >0,5.
The ratio value below the minimum means a strong dependence on external sources of financing, that by deterioration in market environment may lead to a liquidity crisis and an unstable financial situation of a company.
The experts of the Information agency Credinform, taking into account the actual situation both in the economy as a whole and in the sectors, has developed and implemented in the Information and Analytical system Globas the calculation of practical values of financial ratios that can be recognized as normal for a particular industry. For software developers the practical value of solvency ratio made from 0,04 up to 0,94 in 2017.
For getting of the most comprehensive and fair picture of the financial standing of an enterprise it is necessary to pay attention to all combination of indicators and financial ratios.
| Name, INN, region | Revenue, billion RUB | Net profit (loss), billion RUB | Solvency ratio (x), >0,5 | Solvency index Globas | |||
| 2016 | 2017 | 2016 | 2017 | 2016 | 2017 | ||
| 1 | 2 | 3 | 4 | 5 | 6 | 7 | 8 |
| YANDEX LLC INN 7736207543 Moscow |
|
|
|
|
|
|
178 High |
| KASPERSKY LAB NJSC INN 7713140469 Moscow |
|
|
|
|
|
|
187 High |
| SKB KONTUR JSC INN 6663003127 Sverdlovsk region |
|
|
|
|
|
|
179 High |
| YANDEX.TAXI LLC INN 7704340310 Moscow |
|
|
|
|
|
|
314 Adequate |
| MICROSOFT RUS LLC INN 7743528989 Moscow |
|
|
|
|
|
|
189 High |
| NEFTEAVTOMATIKA JSC INN 0278005403 Republic of Bashkortostan |
|
|
|
|
|
|
185 High |
| SBERBANK – TECHNOLOGIES NJSC INN 7736632467 Moscow |
|
|
|
|
|
|
256 Medium |
| RT-INVEST TRANSPORT SYSTEMS LLC INN 7704869777 Moscow |
|
|
|
|
|
|
249 Strong |
| FORS - DEVELOPMENT CENTER LLC INN 7702270040 Moscow |
|
|
|
|
|
|
179 High |
| RVO GROUP LLC INN 7702531291 Moscow |
|
|
|
|
|
|
235 Strong |
| Total by TOP-10 companies | |
|
|
|
|||
| Average value by TOP-10 companies | |
|
|
|
|
|
|
| Industry average value | |
|
|
|
|
|
|
![]() improvement of the indicator to the previous period,
improvement of the indicator to the previous period, ![]() decline in the indicator to the previous period.
decline in the indicator to the previous period.
The average value of the solvency ratio of TOP-10 enterprises is below industry average and recommended values. Seven companies improved results in 2017.
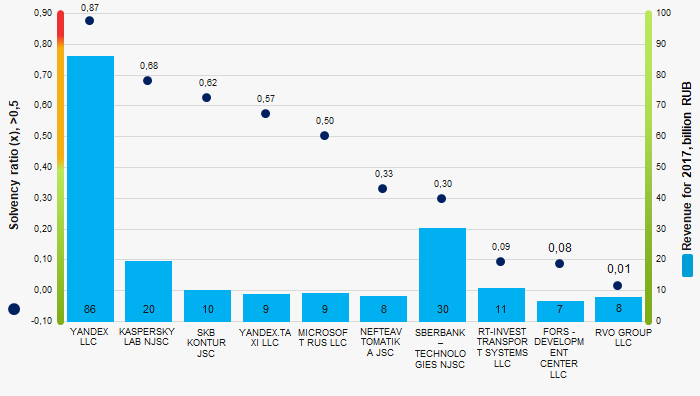 Picture 1. Solvency ratio and revenue of the largest Russian software developers (TOP-10)
The industry average indicators of the solvency ratio tend to decrease over the course of 10 years (Picture 2).
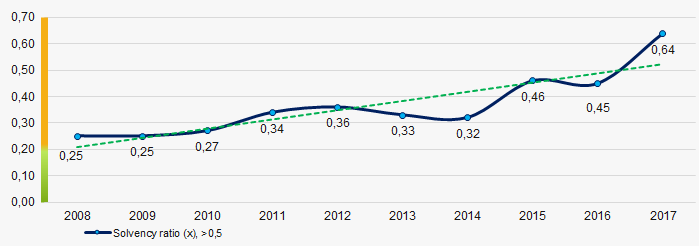 Picture 2. Change in industry average values of the solvency ratio of Russian software developers in 2008 – 2017