
Order a report
Custom-made industry research, company ratings, competitor analysis


TOP-10 Russian manufacturers of bread and bakery products in terms of revenue for 2018
Information agency Credinform presents ranking of Russian manufacturers of bread and bakery products. Experts of the agency, using Information and Analytical system Globas, have selected TOP-10 manufacturers of bakery products in terms of revenue for 2018, analyzed tax payments of every enterprise to the budget of Russia and defined characteristics of the market.
Bread is one of the oldest food products in the world. For Russians bread has always been essential element. It has great history and is connected with plenty of traditions and memories. During the Leningrad Blockade it helped to save many lives. Although, in terms of ingredients it hardly resembled familiar food product
Before the transition to postindustrial society hard and menial labor prevailed in Russia, and bread was the only available product for workers to recover strength and be sated without burdening a budget.
Bread is a good of first priority, and its` production is one of the most important industries in any country.
According to the data of the Information and Analytical system Globas, TOP-10 companies take only 11,2% of the market in terms of comprehensive annual revenue, that amounted to 345,8 billion RUB, following the results of 2018.
Remarkably, revenue of companies is distributed equally, and industrial concentration is moderate, new manufacturers often appear at the market. TOP-60 companies take only 38,5% of the industry.
| № | Manufacturer name | Revenue for 2018, billion RUB | Tax payments for 2018, billion RUB | |
| 1 | KARAVAI Saint Petersburg |
6473,0 | -6,5% | 558,4 |
| 2 | BKK Kolomenskiy Moscow |
6367,8 | +32,0% | 431,8 |
| 3 | LIMAK Lipetsk |
5873,2 | -2,0% | 457,9 |
| 4 | PERVYI KHLEBOKOMBINAT Chelyabinsk |
4149,6 | -0,4% | 564,9 |
| 5 | THE GROUP OF COMPANIES DARNITSA Saint Petersburg |
3947,6 | -0,3% | 74,7 |
| 6 | CONFECTIONARY AND BREAD FACTORY CHERIOMUSHKI Moscow |
3497,7 | +5,8% | 314,4 |
| 7 | Lantmannen Unibake Egoryevsk (Moscow region) |
3291,7 | +30,0% | 159,4 |
| 8 | SMAK Ekaterinburg |
2952,9 | +9,2% | 213,2 |
| 9 | VOLZHSKY PEKAR Tver |
2791,5 | -6,1% | 265,4 |
| 10 | KHLEBOZAVOD №28 Moscow |
2357,3 | +13,0% | 100,1 |
The largest Russian manufacturer of bread and bakery products is KARAVAI (6,4 billion RUB), located in Saint Petersburg, share of its`s production is 1,9 % of the total revenue in the industry. Amount of tax payments of the company to the budget of Russia amounted to more than 550 million RUB in 2018. For one year revenue has decreased on 6,5%, and industrial volume on 2%.
Decrease in revenue of the majority of Russian manufacturers is related to reduction of bread products consumption (Picture 1). Since 2010-2018 consumption has decreased on 3,3%, and following the results of 2019 and 2020, continuation of the existing trend should be expected. Decrease in consuming of bakery products among Russians is connected with pursuance of healthy lifestyle and switch to dietetic, light, healthy nutrition. Ration is also becoming more diversified: bread is replaced with other available food products.
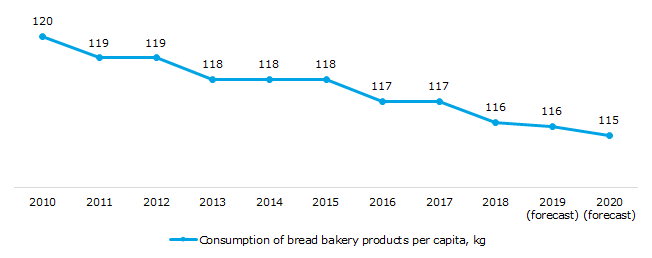 Picture 1. Dynamics of bread and bakery consumption (on a per capita basis) in 2010-2020, kg
Source: Unified Interdepartmental Statistical Information System, calculation by Credinform
However, part of the top group demonstrate increase in revenue on 5, 9 and even 30%.
With the help of the instrument of the Information and Analytical system Globas – Сompany's position in the industry, the reason for increase in revenue of Moscow bread-baking factories was figured out. The point is that companies started leaving the market for various reasons. Amount of liquidations has increased on 26,5%. Vacant shares of the market are distributed between large manufacturers of bread and bakery products, thereby promoting increase offtake of products and sales.
Therefore, bakery and confectionary factories Kolomenskoe (2-nd place; 6,4 billion RUB), Cheriomushki (6-th place; 3,5 billion RUB) and Khlebozavod №28 (10-th place; 2,4 billion RUB) demonstrate revenue growth, on the back of general reduction of consumption.
Lantmannen Unibake company takes seventh place in the ranking (3,3 billion RUB). Revenue of the enterprise has increased on 30,0% for a year. Growth of an indicator is mainly connected with the uniqueness of the sold product range. The company produces burger, hot-dog and sandwich rolls, for cafes and fast food restaurants. These products are of great demand among Russian people, as it is fast, cheap and tasty.
Bread-baking manufacture is one of the most important industry of Russia not only because of good of first priority production, but also in terms of amount of tax payments to the state budget. 3,1 billion RUB as taxation of the TOP-10 manufacturers of bread-baking products was entered to the Treasury of the RF in 2018.
Results of the ranking have shown that bread-baking industry still remains vitally important for the country, in spite of general decrease in bakery products consumption among the population. In general, bread and bakery products manufacturing industry is one of the most well-balanced in the economy. Shares of companies are equally distributed between the market participants and new manufacturers appear.