
Order a report
Custom-made industry research, company ratings, competitor analysis

The largest companies of Russia
The economy of the Russian Federation is ranked the 6th in the world and the 2nd in Europe by the GDP volume (by the Purchasing Power Parity), and the 11th in the world and the 4th in Europe by the nominal GDP volume. Russia is among the leaders by mining and export of mineral resources; sales revenue forms the country’s budget. The experts of the Information Agency Credinform have made a research on the share of the fuel and energy complex in the TOP-30 of the largest companies, and on the validity of the opinion on insufficient diversification of the Russian economy.
| No. | Company | Net profit for 2019, billion RUB | Change to 2018 | Business activity |
| 1 | OIL COMPANY ROSNEFT |
6827,5 | -2,0% | Oil and gas |
| 2 | GAZPROM |
4758,7 | -8,1% | Oil and gas |
| 3 | RUSSIAN RAILWAYS |
1848,1 | +18,5% | Transportation |
| 4 | GAZPROM NEFT |
1809,8 | -12,6% | Oil and gas |
| 5 | SURGETNEFTEGAZ |
1555,6 | +2,0% | Oil and gas |
| 6 | MAGNIT |
1396,5 | +9,0% | Trade |
| 7 | AGROTORG |
1234,4 | +19,0% | Trade |
| 8 | GAZPROM MEZHREGIONGAZ |
1099,1 | -7,8% | Oil and gas |
| 9 | TRANSNEFT |
960,8 | +2,5% | Oil and gas |
| 10 | PEREKRESTOK |
906,7 | +3,2% | Trade |
| 11 | MMC NORILSK NICKEL |
878,1 | +44,2% | Metallurgy |
| 12 | LUKOIL WESTERN SIBERIA |
849,7 | -1,2% | Oil and gas |
| 13 | TATNEFT |
827,0 | +4,3% | Oil and gas |
| 14 | TC MEGAPOLIS |
744,9 | +6,1% | Trade |
| 15 | OIL COMPANY BASHNEFT |
703,1 | -6,9% | Oil and gas |
| 16 | GAZPROMNEFT-REGIONAL SALES |
617,9 | -6,7% | Oil and gas |
| 17 | AEROFLOT-RUSSIAN AIRLINES |
551,8 | +9,3% | Transportation |
| 18 | NOVATEK |
528,5 | -5,7% | Oil and gas |
| 19 | SAMOTLORNEFTEGAZ |
468,8 | +0,8% | Oil and gas |
| 20 | SIBUR HOLDING |
462,9 | -4,8% | Oil and gas |
| 21 | SEVERSTAL |
457,6 | +5,7% | Metallurgy |
| 22 | CONCERN ROSENERGOATOM |
456,7 | +17,0% | Electric power |
| 23 | LUKOIL-VOLGOGRADNEFTEPERERABOTKA |
456,4 | -0,9% | Oil and gas |
| 24 | LENTA |
445,0 | +1,4% | Trade |
| 25 | LUKOIL |
444,5 | +68,1% | Oil and gas |
| 26 | LUKOIL-KOMI |
442,4 | -5,1% | Oil and gas |
| 27 | MAGNITOGORSK IRON AND STEEL WORKS |
434,9 | -5,1% | Metallurgy |
| 28 | NOVOLIPETSK STEEL |
421,8 | -14,6% | Metallurgy |
| 29 | LUKOIL-PERMNEFTEORGSINTEZ |
390,8 | +0,7% | Oil and gas |
| 30 | VANKORNEFT |
383,3 | -9,9% | Oil and gas |
The analysis shows that companies of the fuel and energy complex dominate the TOP-30 with the share of 60%. Picture 1 presents distribution of the shares of the TOP-30 largest companies by the industries.
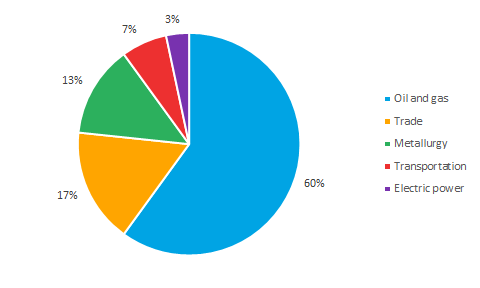 Picture 1. Distribution of companies by the industry
Following the results of the ranking, the oil and gas companies still have the leading positions. However, it does not mean that the Russian economy is not diversified enough. Russia is ranked the 2nd in the world by mining and export of crude oil and natural gas extraction, also it is the 1st by export of natural gas in the world. That is why so many companies of the fuel and energy complex are included in the TOP-30. The number of these companies will be much less in the TOP-100, for instance.