
Order a report
Custom-made industry research, company ratings, competitor analysis


TOP 10 natural gas producers
During the energy crisis in Europe, Russia is increasing its foreign gas supplies. Eight of the ten leading gas producing companies in the country are included in Gazprom Group. Analysis of the solvency ratio shows, on average, a low dependence of TOP 10 enterprises on external loans in 2020, with declining revenues and growing profits.
Information agency Credinform has selected for this ranking in Globas the largest Russian producers of natural gas and condensate. Companies with the largest volume of annual revenue (TOP 10) were selected for the ranking, according to the data from the Statistical Register and the Federal Tax Service for the latest available periods (2018 - 2020). They were ranked by solvency ratio (Table 1).
Solvency ratio (х) is calculated by dividing total equity by total assets. Shows the dependence of the company on external loans. The recommended value is >0,5.
The value of the ratio below the minimum one indicates a strong dependence on external sources of funds, which, if the market conditions deteriorate, can lead to a liquidity crisis and an unstable financial position of the company.
For the most complete and objective view of the financial condition of the enterprise, it is necessary to pay attention to the complex of indicators and financial ratios of the company.
| Name, INN, region | Revenue, million RUB | Net profit (loss), million RUB | Solvency ratio (x), >0,5 | Solvency index Globas | |||
| 2019 | 2020 | 2019 | 2020 | 2019 | 2020 | ||
| 1 | 2 | 3 | 4 | 5 | 6 | 7 | 8 |
| JSC GAZPROM DOBYCHA TOMSK INN 7019035722 Tomsk region |
|
|
|
|
|
|
253 Medium |
| LLC GAZPROM DOBYCHA ORENBURG INN 5610058025 Orenburg region |
|
|
|
|
|
|
272 Medium |
| LLC GAZPROM DOBYCHA NOYABRSK INN 8905026850 Yamal-Nenets autonomous district |
|
|
|
|
|
|
237 Strong |
| LLC NOVATEK-YURKHAROVNEFTEGAZ INN 8903021599 Yamal-Nenets autonomous district |
|
|
|
|
|
|
256 Medium |
| JSC SEVERNEFTEGAZPROM INN 8912001990 Yamal-Nenets autonomous district |
|
|
|
|
|
|
157 Superior |
| LLC NOVATEK-TERKOSALENEFTEGAZ INN 8911020768 Yamal-Nenets autonomous district |
|
|
|
|
|
|
203 Strong |
| LLC GAZPROM DOBYCHA URENGOI INN 8904034784 Yamal-Nenets autonomous district |
|
|
|
|
|
|
191 High |
| LLC GAZPROM DOBYCHA NADYM INN 8903019871 Yamal-Nenets autonomous district |
|
|
|
|
|
|
217 Strong |
| LLC GAZPROM DOBYCHA YAMBURG INN 8904034777 Yamal-Nenets autonomous district |
|
|
|
|
|
|
202 Strong |
| LLC GAZPROM DOBYCHA ASTRAKHAN INN 3006006420 Astrakhan region |
|
|
|
|
|
|
281 Medium |
| Average value for TOP 10 | |
|
|
|
|
|
|
| Industry average value (oil and gas extraction) | |
|
|
|
|
|
|
![]() growth of indicator to the previous period,
growth of indicator to the previous period, ![]() fall of indicator to the previous period
fall of indicator to the previous period
The average 2020 value of solvency ratio of TOP 10 was above the industry average one. Six of TOP 10 companies had decrease in 2020, while in 2019 the decrease was recorded for four companies.
Two of ten companies gained revenue and four ones gained net profit in 2020.
The decrease in average revenue was 10%, and there was 33% fall of the industry average value.
The average profit of TOP 10 have increased almost 9%. However, on average in the industry, the decrease was recorded by almost 26%.
The industry average values of solvency ratio have raised for three periods during the past 5 years. The highest value was recorded in 2018 and the lowest one was in 2016 (Picture 1).
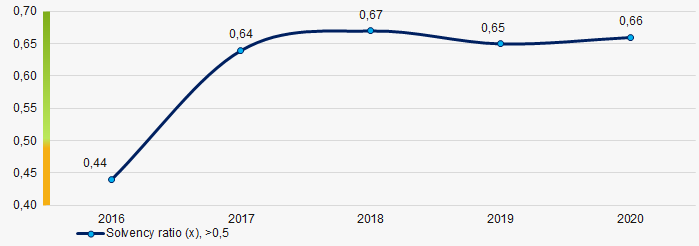 Picture 1. Change in the average values of solvency ratio of natural gas producers in 2016 - 2020