
Order a report
Custom-made industry research, company ratings, competitor analysis


Trends in the activity of the largest Russian manufacturers of bakery and confectionary products
Information agency Credinform has observed trends in the activity of the largest Russian manufacturers of bakery and confectionary products.
Enterprises with the largest volume of annual revenue (TOP-10 and TOP-1000), were selected for the analysis, according to the data from the Statistical Register for the latest available periods (for 2014, 2015, 2016). The analysis was made on the basis of the data of the Information and Analytical system Globas.
Net assets — the indicator, reflecting the real value of company’s property, is calculated annually as the difference between assets on the enterprise balance and its debt obligations. The indicator of net assets is considered negative (insufficiency of property), if company’s debt exceeds the value of its property.
| № in TOP-1000 | Name, INN, region | Net assets value, mln RUB* | Solvency index Globas | ||
| 2014 | 2015 | 2016 | |||
| 1 | 2 | 3 | 4 | 5 | 6 |
| 1. | MARS LLC INN 5045016560 Moscow region Manufacture of chocolate and sugar confectionary products |
66 325 | 80 994 | 82 668 | 190 High |
| 2. | JSC FERRERO RUSSIA INN 5044018861 Vladimir region Manufacture of chocolate and sugar confectionary products |
8 280 | 11 118 | 13 418 | 146 Superior |
| 3. | JSC CONFECTIONARY CONCERN BABAYEVSKY INN 7708029391 Moscow Manufacture of chocolate and sugar confectionary products |
9 814 | 10 533 | 10 544 | 200 Strong |
| 4. | JSC CONFECTIONARY PLANT SLAVYANKA INN 3128001300 Belgorod region Manufacture of chocolate and sugar confectionary products |
8 945 | 10 933 | 10 333 | 224 Strong |
| 5. | MON'DELEZ RUS LLC INN 3321020710 Vladimir region Manufacture of chocolate and sugar confectionary products |
10 342 | 4 273 | 5 426 | 232 Strong |
| 996. | RUSCO LLC INN 5022070360 Moscow region Manufacture of crisp bread, cookies, crackers and other crisp bakery products, pastry, cakes and fancy cakes, pies and biscuits of long term storage |
84 | -72 | -181 | 342 Adequate |
| 997. | LLC TRADE HOUSE WOLKONSKY INN 7704639396 Moscow Manufacture of bread and pastry, cakes and fancy cakes of short term storage |
-146 | -128 | -196 | 325 Adequate |
| 998. | SUNNY CAKE LLC INN 5044022794 Moscow region Manufacture of bread and pastry, cakes and fancy cakes of short term storage |
1 020 | 2 | -333 | 245 Strong |
| 999. | LLC KONDITERSKAYA FABRIKA INN 5754022855 Orel region Manufacture of chocolate and sugar confectionary products |
-400 | -470 | -497 | 315 Adequate |
| 1000. | KELLOGG RUS LLC INN 5045016560 Voronezh region Manufacture of crisp bread, cookies, crackers and other crisp bakery products, pastry, cakes and fancy cakes, pies and biscuits of long term storage |
-5 702 | -7 608 | -7 778 | 273 Medium |
* — the indicators of growth or decline to the previous period are marked in columns 4 and 5 with green and red fillings, respectively.
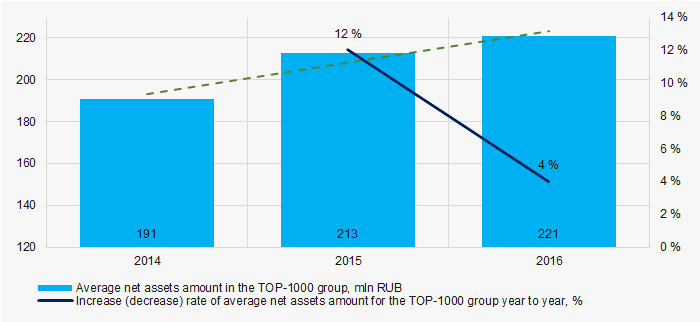 Picture 1. Change in TOP-1000 average indicators of the net asset value of manufacturers of bakery and confectionary products in 2014 — 2016
Sales revenue
The revenue of 10 leaders of the industry made 40% of the total revenue of TOP-1000 companies in 2016. It demonstrates relatively high level of competition in the industry (Picture 2).
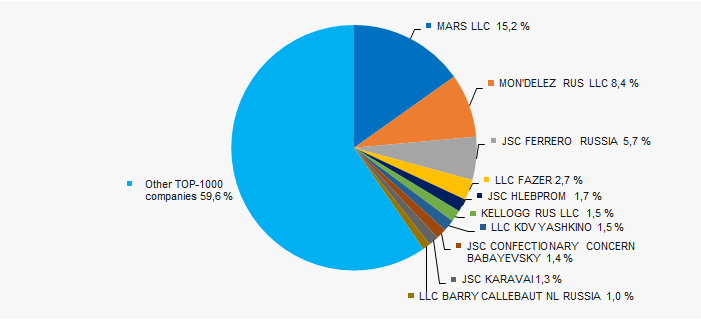 Picture 2. Shares of participation of TOP-10 companies in the total revenue of TOP-1000 companies for 2016
In general, an increasing tendency of the volume revenue is observed (Picture 3).
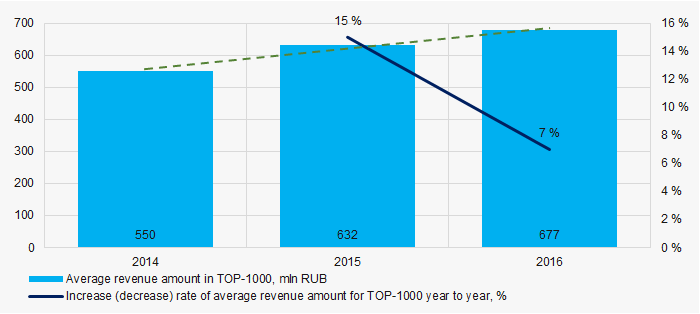 Picture 3. Shares of participation of TOP-10 companies in the total revenue of TOP-1000 companies for 2016
Profit and losses
The profit volume of 10 leading enterprises in 2016 made 81% of the total profit of TOP-1000 companies (Picture 4).
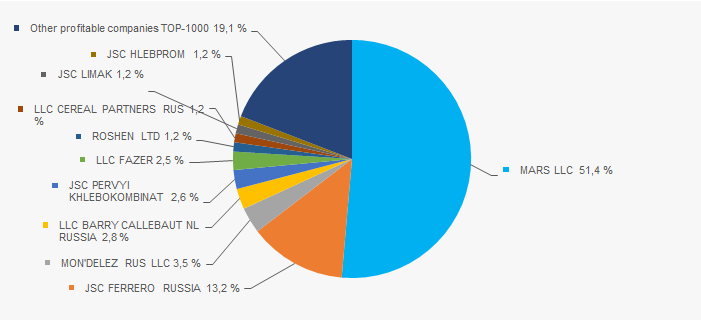 Picture 4. Share of participation of TOP-10 companies in the total volume of profit of TOP-1000 companies for 2016
Over a three-year period, the average values of profit indicators of the TOP-1000 group tend to decrease. However, the average value of net loss increases (Picture 5).
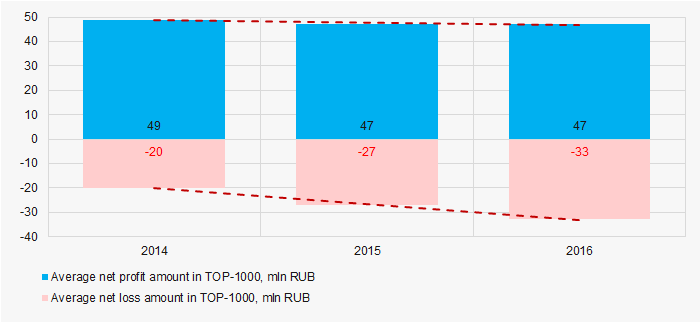 Picture 5. Change in the industry average indicators of profit and loss of manufacturers of bakery and confectionary products in 2014 — 2016
Key financial ratios
The total liquidity ratio (the relation of the amount of current assets to short-term liabilities) shows the sufficiency of company’s funds for repayment of its short-term liabilities.
Over the three-year period the industry average indicators of the total liquidity ratio were above the range of recommended values — from 1,0 up to 2,0 (Picture 6). In general, the ratio indicator tends to increase.
The experts of the Information agency Credinform, taking into account the actual situation both in the economy as a whole and in the sectors, has developed and implemented in the Information and Analytical system Globas the calculation of practical values of financial ratios that can be recognized as normal for a particular industry.
For companies in the sphere of packaging production the practical value of the total liquidity ratio made from 1,79 and up to 1,38 in 2016.
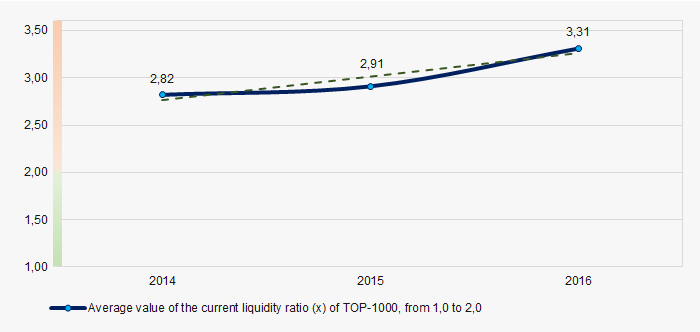 Picture 6. Change in the average industry values of the total liquidity ratio of manufacturers of bakery and confectionary products in 2014 — 2016
The return on investment ratio is calculated as the relation of net profit to the sum of own capital and long-term liabilities and demonstrates the return on the equity involved in the commercial activity of own capital and the long-term borrowed funds of an organization.
Unstable indicators of the return on investment ratio, with decreasing tendency (Picture 7) have been observed for three years. (Picture 7).
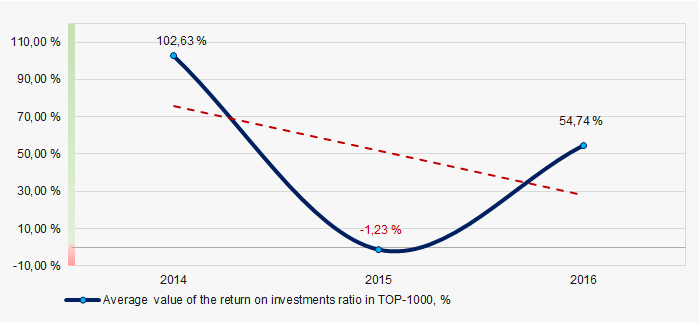 Picture 7. Change in the average industry values of the return on investment ratio of manufacturers of bakery and confectionary products in 2014 — 2016
Asset turnover ratio is calculated as the relation of sales proceeds to the average value of total assets for a period and characterizes the efficiency of use of all available resources, regardless of the sources of their attraction. The ratio shows how many times a year a complete cycle of production and circulation is made, yielding profit.
This business activity ratio showed a decreasing tendency for three-year period (Picture 8).
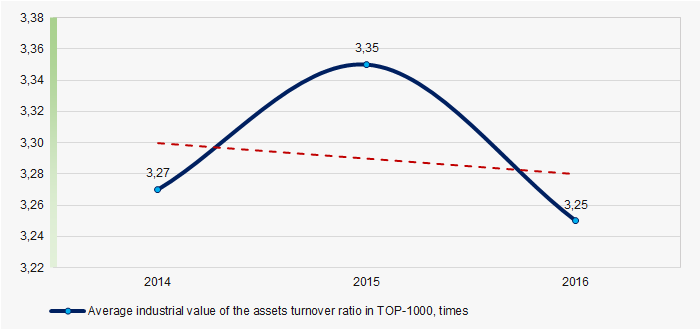 Picture 8.Change in the average industry values of the asset turnover ratio of manufacturers of bakery and confectionary products in 2014 — 2016
Production structure
The largest share in the total revenue of TOP-1000 is owned by companies, specializing in the manufacture of chocolate and sugar products (Picture 9).
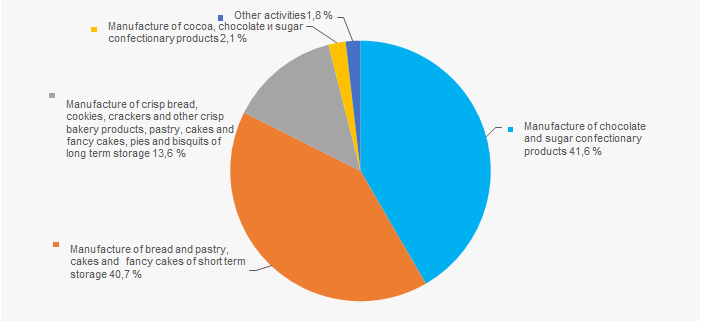 Picture 9. Distribution of companies by types of output in the total revenue of TOP-1000, %
67% of TOP-1000 companies are registered in the Register of small and medium enterprises of the Federal Tax Service of the RF (Picture 10).
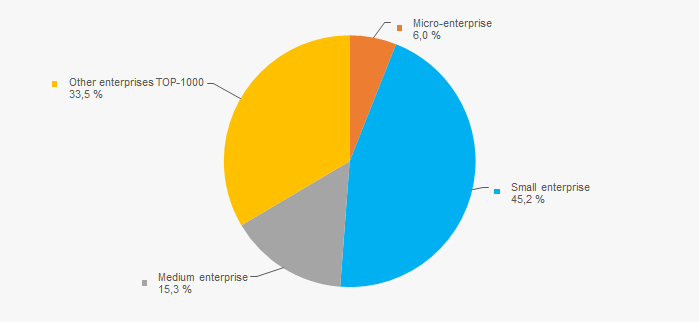 Picture 10. Shares of small and medium enterprises in TOP-1000 companies, %
Main regions of activities
TOP-1000 companies are unequally distributed across the Russian territory and registered in 79 regions (Picture 11).
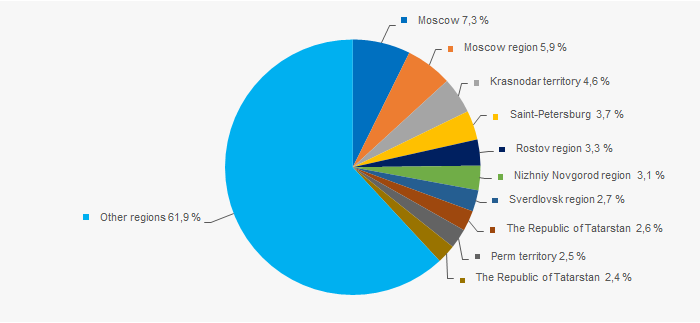 Picture 11. Distribution of TOP-1000 companies by regions of Russia
Financial position score
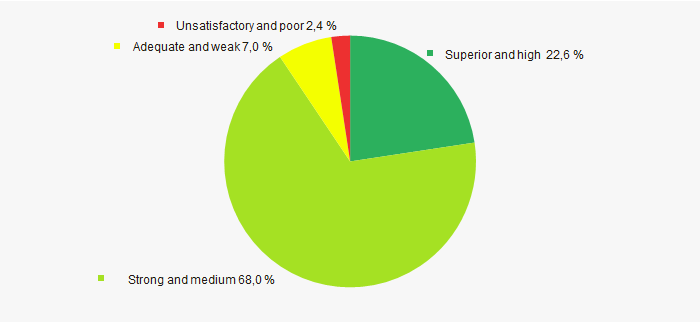
An assessment of the financial position of companies in the industry shows that the largest number is in a stable financial position and above the average (Picture 12).
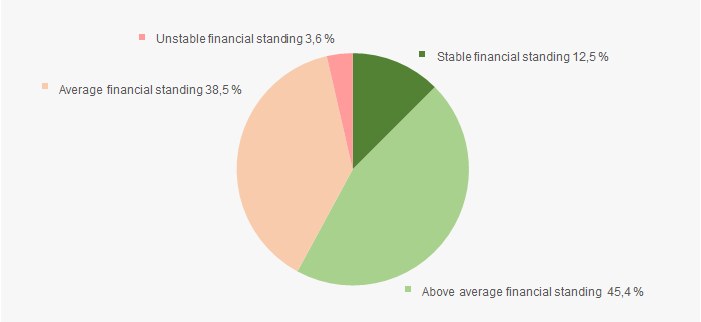 Picture 12. Distribution of TOP-1000 companies by financial position score
Solvency index Globas
Most of TOP-1000 companies have got Superior or High Solvency index Globas, чthat points to their ability to repay their debts in time and fully (Picture 13).
 Picture 13. Distribution of TOP-1000 companies by solvency index Globas
Conclusion
Comprehensive assessment of the activity of manufacturers of bakery and confectionary products, taking into account the main indexes, financial indicators and ratios, demonstrates the domination of favorable trends in the industry. In general, relative stability is observed in the industry. However, among disturbing factors are decreasing profitability, investment and business activity.