
Order a report
Custom-made industry research, company ratings, competitor analysis


Debt ratio of the largest Russian machines and machine-tool equipment manufacturers
Information agency Credinform presents the ranking of the largest Russian machines and machine-tool equipment manufacturers on debt ratio. The largest by revenue companies in this industry for the last available in the Statistical register period (2014) were taken for the investigation. Further the TOP-10 enterprises were ranked in the ascending order of debt ratio value (Table 1).
Debt ratio is one of the financial stability ratios. The ratios of this group are the most interesting in terms of exploring the possibility of granting the long-term loans or investing as it characterizes the possibility of the company to meet its long-term obligations. Thus, the debt ratio is calculated as a ratio of total borrowed funds to equity capital and shows how many units of borrowed funds the company had attracted to each unit of own sources of financing.
The recommended value of the ratio is less than 1. The debt to assets ratio should not be negative, that’s why the ratio value from 0 to 1 is one of the indicators of company’s high ability to meet its obligations.
Taking into account the actual position of economy in the whole as well as industries, experts of the Information agency Credinform developed and implemented in the Information and Analytical system Globas- i® the calculation of financial ratios practical values, which can be considered normal for their industry. Practical value of the Debt ratio for machine-tool manufacture ranges from 0,01 to 8,75.
| Name, Tax number, Region | Net profit (loss) 2014, th RUB | Revenue 2014, th RUB | Revenue 2014 to 2013, % | Debt ratio, (х) | Solvency index Globas-i |
|---|---|---|---|---|---|
| ZAO NPF INZHENERNY I TEKHNOLOGICHESKY SERVIS Tax number 7806013625 Saint-Petersburg |
86 308 | 1 148 789 | 93 | 0,19 | 238 High |
| PAO TJAZHPRESSMASH Tax number 6229009163 Ryazan region |
156 429 | 2 767 065 | 119 | 0,47 | 214 High |
| PAO TJAZHMEKHPRESS Tax number 3662118923 Voronezh region |
17 673 | 2 312 706 | 257 | 2,41 | 248 High |
| PAO SASTA Tax number 6232000019 Ryazan region |
3 519 | 509 521 | 69 | 2,45 | 272 High |
| PELCOM DUBNA MACHINE-BUILDING FACTORY LTD. Tax number 5010025437 Moscow region |
-101 664 | 416 879 | 42 | 2,82 | 317 Satisfactory |
| LLC NPO STANKOSTROENIE Tax number 268061504 Republic of Bashkortostan |
7 332 | 632 194 | 126 | 6,12 | 299 High |
| NAO PSKOVELEKTROSVAR Tax number 6027076488 Pskov region |
578 | 727 007 | 90 | 9,89 | 304 Satisfactory |
| NAO STANKOTECH Tax number 7715555765 Moscow |
1 458 | 663 202 | 102 | 32,63 | 207 High |
| LLC POWER PRESS WORKS Tax number 2221202506 Altai Territory |
170 | 663 492 | 87 | 305,01 | 265 High |
| LLC SAVELOVSKI MACHINE BUILDING PLANT Tax number 7704802518 Tver region |
-675 445 | 677 468 | 135 | -2,89 | 355 Satisfactory |
The obtained results give evidence to the fact that the debt ratio of 2 companies from the TOP-10 - ZAO NPF INZHENERNY I TEKHNOLOGICHESKY SERVIS and PAO TJAZHPRESSMASH satisfy the recommended standards. The following 3 companies PAO TJAZHMEKHPRESS, PAO SASTA and PELCOM DUBNA MACHINE-BUILDING FACTORY LTD. have the indicator which stays within the practical standard. The rest 4 companies show the ratio values from 6,12 to 305,01. The debt ratio of LLC SAVELOVSKI MACHINE BUILDING PLANT has a negative value. Total borrowed assets of this company exceed the equity amount and the losses in 2014 which amounted to more than 600 million RUB are commensurate with the earned revenue.
The industry-average indicator amounted to 5,07. All the above mentioned speaks for high debt load of both companies in the bottom lines of the Top-10 and companies in the industry in the whole.
7 companies of the TOP-10 were given the high solvency index Globas-i® by the complex of financial and nonfinancial indicators, which characterizes them as financially stable. PELCOM DUBNA MACHINE-BUILDING FACTORY LTD., NAO PSKOVELEKTROSVAR and LLC SAVELOVSKI MACHINE BUILDING PLANT were given the satisfactory solvency index Globas-i®. It is first of all connected with losses in 2013-2014 and revenue volume reduction.
Figure 1. Debt ratio of machines and machine-tools manufacturers (TOP-10)
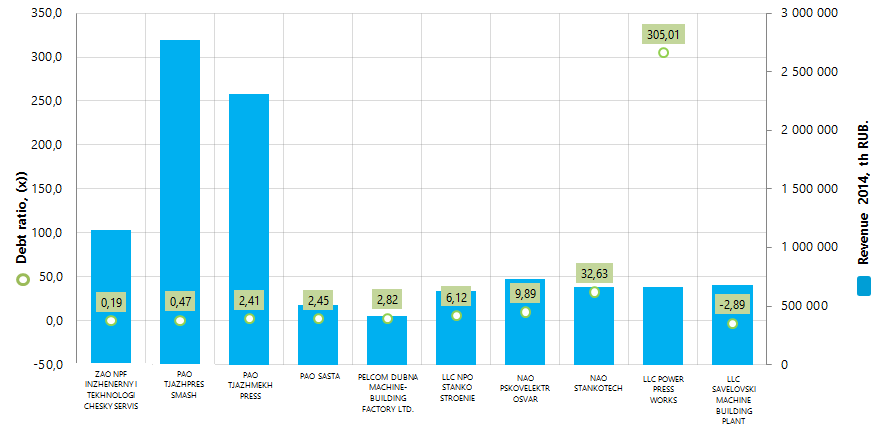
The largest by revenue companies in this industry for 2014 PAO TJAZHPRESSMASH and PAO TJAZHMEKHPRESS are placed on the second and third spots of the ranking with debt indicators that equal to 0,47 and 2,41 respectively. The total revenue of these companies for 2014 amounted to more than 5 billion RUB or 48% in the total volume of revenue by the TOP-10. ZAO NPF INZHENERNY I TEKHNOLOGICHESKY SERVIS shows the best indicator value 0,19.
The total revenue volume of the TOP-10 for 2014 amounted to 10,5 billion RUB, which is by 12% greater than the same indicator for 2013.
The respectively balanced distribution of machine-tools enterprises along Russia is important to be noted. The biggest amount of these companies is registered in Moscow, Ryazan, Moscow and Orenburg regions.
For reference
Figure 2. The Federal State Statistics Service (Rosstat) data on manufacture of cutting and woodworking machines in 2010-2015 (piece)
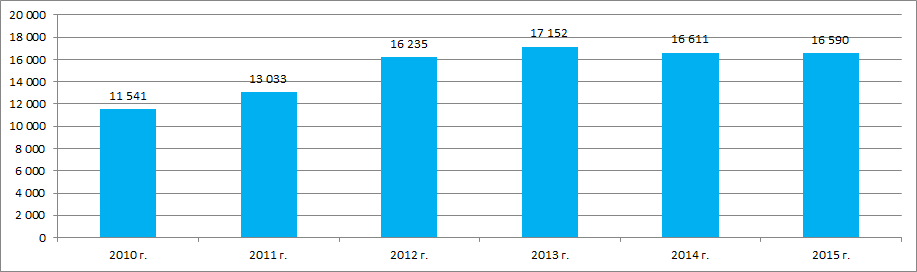
Thus for the last full 6 years in a row the biggest amount of machines was manufactured in 2013. The gain in production output in 2013 to 2010 amounted to 49%. Production output in 2015 to 2010 and 2013 amounted to 144% and 97% respectively.
The biggest share of the manufactured machines in 2015 in the nomenclature accrues to: woodworking machines – 29%; threading and nut-threading cutting machines – 18%; woodworking bandsaw machines – 9%; woodworking machines designed for the certain industry – 9%; machines for deflashing, tool grinding, polishing, finishing (honing), cutting or planning machines or for other types of metalworking – 9%; beam-pumping unit for the oil industry.