
Order a report
Custom-made industry research, company ratings, competitor analysis


Activity trends of telecommunications companies
Information Agency Credinform presents a review of activity trends of the largest Russian telecommunications companies.
Telecommunications companies with the largest annual revenue (TOP-10 and TOP-1000) have been selected for the analysis, according to the data from the Statistical Register for the latest available accounting periods (2015 — 2017). The analysis was based on the data from the Information and Analytical system Globas.
Net asset value indicates fair value of corporate assets and is calculated annually as assets on balance less company’s liabilities. Net asset value is negative (insufficiency of property) if liabilities are larger than the property value.
| No. in TOP-1000, Name, INN, region, activity |
Net asset value, billion RUB | Solvency index Globas | ||
| 2015 | 2016 | 2017 | ||
| 1 | 2 | 3 | 4 | 5 |
| 1 PJSC ROSTELECOM INN 7707049388 Saint Petersburg Wired telecommunications activities |
280,38 | |
|
247 Medium |
| 2 JSC MEGAFON INN 7812014560 Moscow Wired telecommunications activities |
163,07 | |
|
235 Strong |
| 3 Mobile TeleSystems JSC INN 7740000076 Moscow Wireless telecommunications activities In process of reorganization in the form of acquisition of other legal entities since 04.07.2018 |
37,88 | |
|
207 Strong |
| 4 PJSC VIMPEL-COMMUNICATIONS INN 7713076301 Moscow Mobile communications services for voice transmission |
119,54 | |
|
188 High |
| 5 JSC Moscow City Telephone Network INN 7710016640 Moscow Wired telecommunications activities Cases on declaring the company bankrupt (insolvent) are proceeding |
98,13 | |
|
550 Insufficient |
| 996 JSC GlobalStar-Space Telecommunications INN 7717089767 Moscow Satellite telecommunications activities |
-1,45 | |
|
269 Medium |
| 997 Trivon Networks LLC INN 5054086236 Moscow Wired telecommunications activities |
-0,33 | |
|
334 Adequate |
| 998 MIRANDA-MEDIA LLC INN 7702527584 Republic of Crimea Data transmission and access to the Internet services |
-0,44 | |
|
302 Adequate |
| 999 STACK DATA NETWORK LLC INN 7713730490 Moscow Telephone communication services |
-0,09 | |
|
331 Adequate |
| 1000DATAPRO LLC INN 7704825145 Moscow Other wired telecommunications activities |
-2,12 | |
|
339 Adequate |
![]() — growth compared to prior period,
— growth compared to prior period, ![]() — decline compared to prior period.
— decline compared to prior period.
Average net assets of TOP-1000 companies tended to decrease during the last decade (Picture 1).
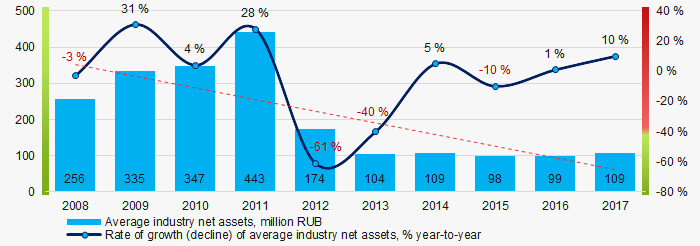 Picture 1. Change in average net assets of telecommunications companies in 2008 — 2017
The share of TOP-1000 companies with insufficiency of property tends to decrease within the last 3 years (Picture 2).
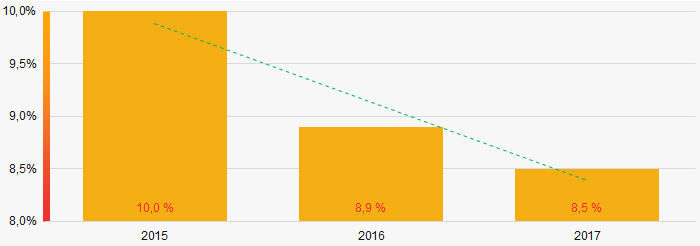 Picture 2. Share of TOP-1000 companies with negative value of net assets in 2015-2017
Sales revenue
In 2017 sales revenue of 10 industry leaders amounted to 78% of total revenue of TOP-1000 companies (Picture 3). This is an indicator of a high level of monopolization within the industry.
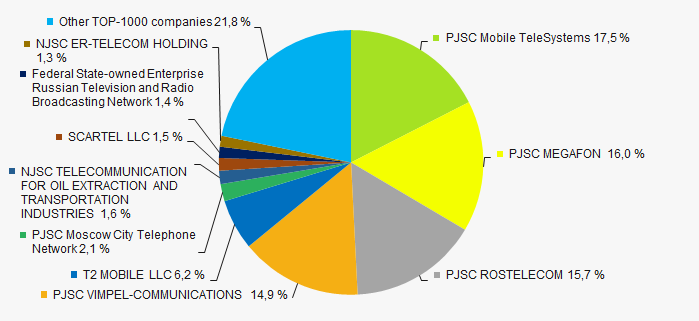 Picture 3. TOP-10 companies by their share in 2017 total revenue of TOP-1000 companies
In general, average industry revenue tends to decrease during the decade (Picture 4).
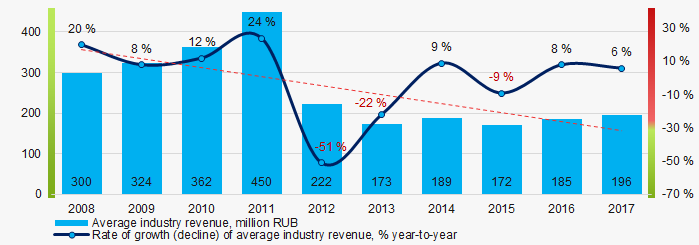 Picture 4. Change of average industry revenue of telecommunications companies in 2008 – 2017
Profit and loss
In 2017 net profit of 10 industry leaders amounted to 89% of total net profit of TOP-1000 companies (Picture 5).
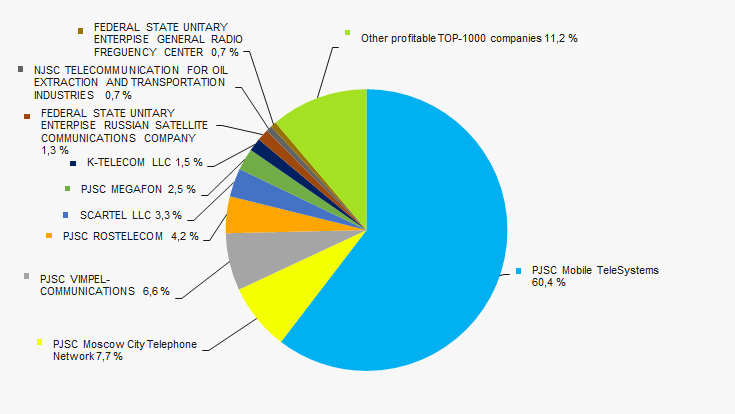 Picture 5. TOP-10 companies by their share in 2017 total net profit of TOP-1000
During the last decade average industry net profit tended to decrease (Picture 6).
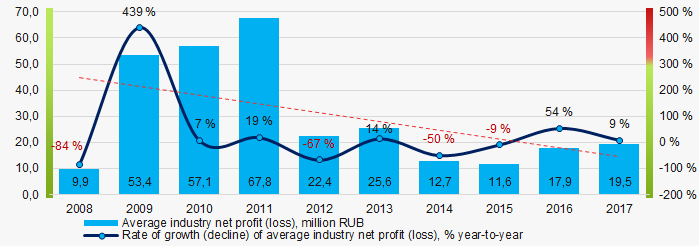 Picture 6. Change in average industry net profit of telecommunications companies in 2008 — 2017
During the last 3 years average industry net profit of TOP-1000 companies increased, and the average net loss decreased (Picture 7).
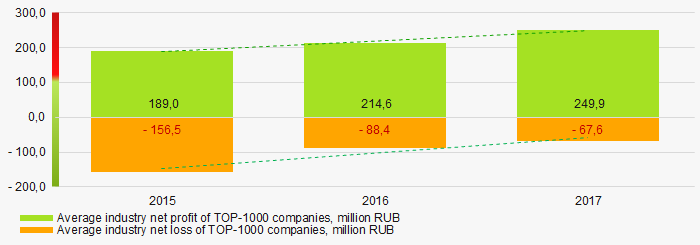 Picture 7. Change in average net profit and loss of TOP-1000 companies in 2015 — 2017
Key financial ratios
During the last decade average values of total liquidity ratio were below the recommended value — from 1,0 to 2,0, tending to decrease (Picture 8).
Total liquidity ratio (a ratio of current assets to current liabilities) reveals the sufficiency of a company’s funds for meeting its short-term liabilities.
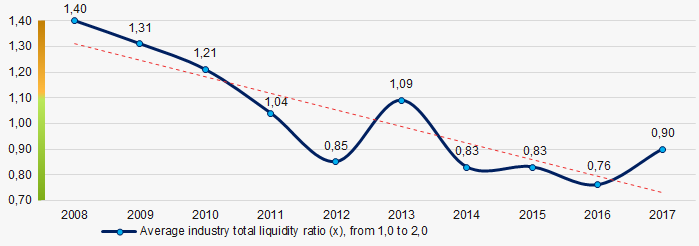 Picture 8. Change in average values of total liquidity ratio of telecommunications companies in 2008 — 2017
During the last decade, average industry values of return on investment ratio tended to grow (Picture 9).
It is a ratio of net profit to total equity and noncurrent liabilities, and it demonstrates benefit from equity engaged in business activity and long-term raised funds of the company.
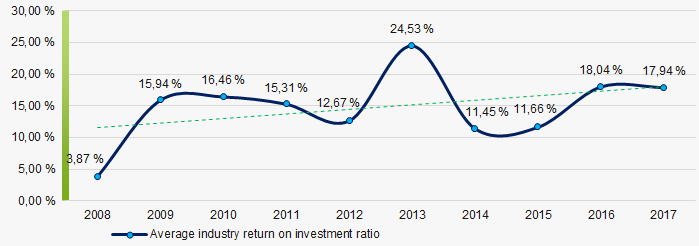 Picture 9. Change in average values of return on investment ratio of telecommunications companies in 2008 — 2017
Assets turnover ratio is a ratio of sales revenue to average total assets for the period, and it measures resource efficiency regardless of the sources. The ratio indicates the number of profit-bearing complete production and distribution cycles per annum.
During the decade, this activity ratio tended to increase (Picture 10).
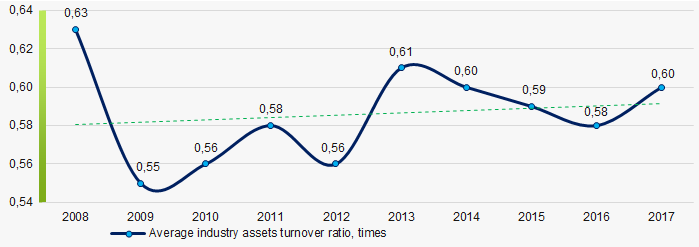 Picture 10. Change in average values of assets turnover ratio of telecommunications companies in 2008 — 2017
Structure of production and services
Companies that provide wired telecommunications services have the majority share in the total revenue of TOP-1000 companies (Picture 11).
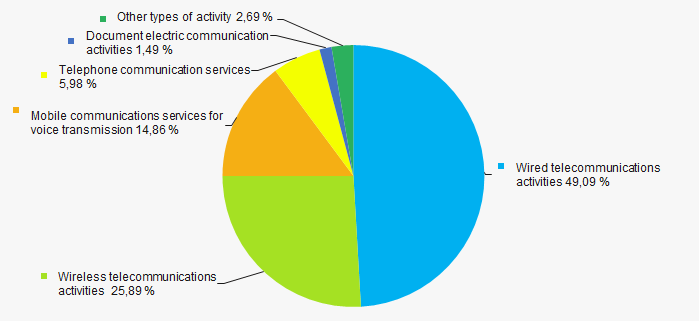 Picture 11. Types of activity by their share in total revenue of TOP-1000 companies
 77% of TOP-1000 companies are included in the Register of small and medium-sized businesses of the Federal Tax Service of the Russian Federation. In general, their share in total revenue of TOP-1000 in 2017 amounted to 6% (Picture 12).
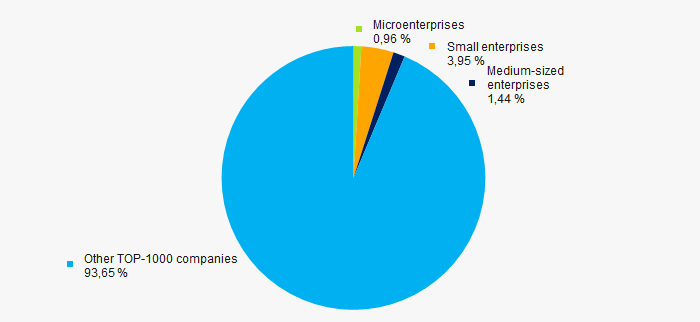 Picture 12. Shares of small and medium-sized enterprises in TOP-1000 companies' revenue, %
Key regions of activity
TOP-1000 companies are unevenly located throughout Russian territory and are registered in 79 regions. The largest revenue shares are concentrated in the major cities - Moscow and Saint Petersburg (Picture 13).
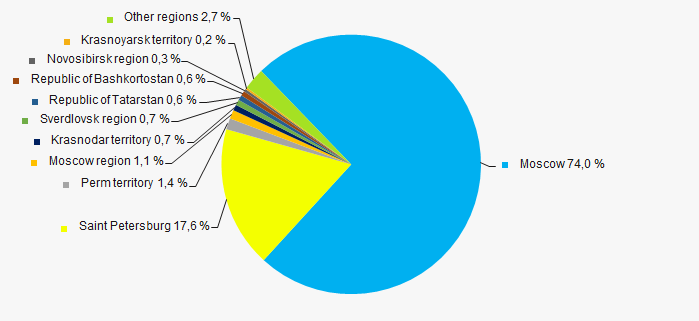 Picture 13. Revenue of TOP-1000 companies by Russian regions
Financial position score
Assessment of financial state of TOP-1000 companies indicates that most of the companies have an above average financial position (Picture 14).
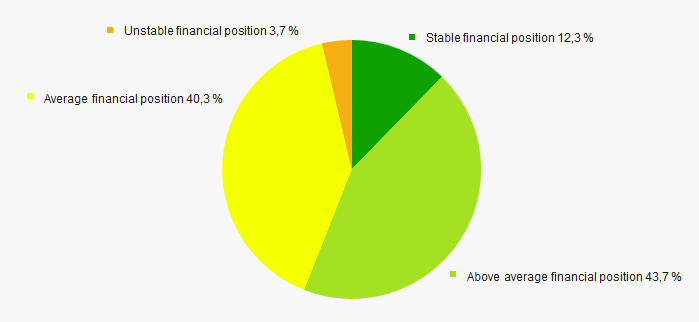 Picture 14. TOP-1000 companies by their financial position score
Solvency index Globas
The majority of TOP-1000 companies have got a superior, high, strong or medium Solvency index Globas, that indicates their capability to meet liabilities timely and in full (Picture 15).
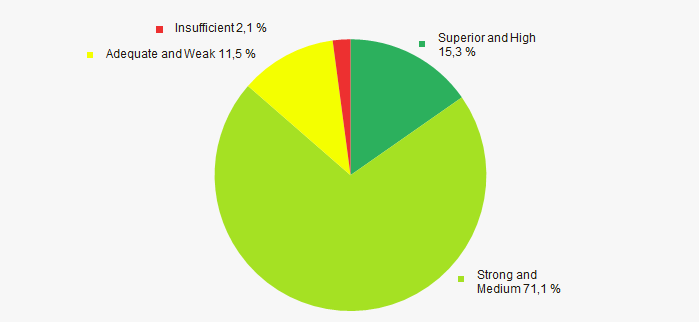 Picture 15. TOP-1000 companies by Solvency index Globas
Conclusion
A comprehensive assessment of the largest telecommunications companies, that considers key indexes, financial figures and ratios, is indicative of lack of clearly defined trends within the sector (Table 2).
| Trends and assessment factors | Relative share of the factor, % |
| Rate of growth (decline) of average industry net assets | |
| Increase/ Decrease of share of companies with negative net assets | |
| Rate of growth (decline) of average industry revenue | |
| Level of competition / monopolization | |
| Rate of growth (decline) of average industry net profit (loss) | |
| Increase/ Decrease of average industry net profit of TOP-1000 companies | |
| Increase/ Decrease of average industry net loss of TOP-1000 companies | |
| Increase/ Decrease of average industry total liquidity ratio | |
| Increase/ Decrease of average industry return on investment ratio | |
| Increase/ Decrease of average industry assets turnover ratio | |
| Share of small and medium-sized business within the industry by revenue over 22% | |
| Regional concentration | |
| Financial standing (majority share) | |
| Solvency index Glogas (majority share) | |
| Average factors' value | |
![]() — positive trend (factor),
— positive trend (factor), ![]() — negative trend (factor).
— negative trend (factor).