
Order a report
Custom-made industry research, company ratings, competitor analysis


Trends in the field of power supply activity
Information agency Credinform represents an overview in the field of power supply activity.
Enterprises with the largest volume of annual revenue (TOP-10 and TOP-500), trading with electricity, were selected for the analysis, according to the data from the Statistical Register for the latest available periods (for 2015 and 2016). The analysis was made on the basis of the data of the Information and Analytical system Globas.
Sales revenue
The revenue of 10 industry leaders made 43% of the total revenue of TOP-500 companies in 2016. It points to a relatively high level of monopolization in the industry. Mosenergosbyt PJSC – guaranteeing supplier of electric power in the territory of Moscow and Moscow region – became the largest company in terms of revenue in 2016 (Picture 1).
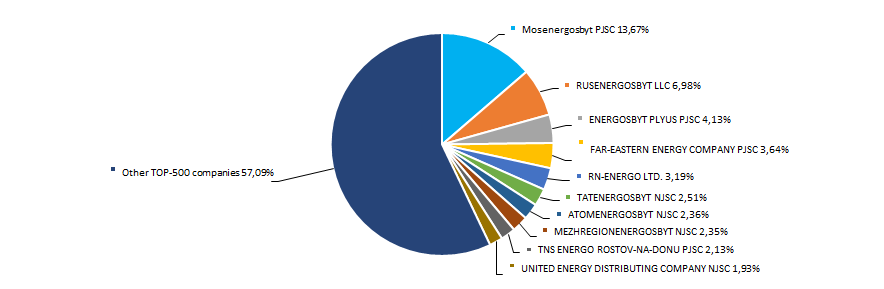 Picture 1. Shares of participation of TOP-10 companies in the total revenue of TOP-500 companies for 2016
The best results in the industry in terms of revenue for the ten-year period were achieved in 2011. During the crisis periods in the economy in 2012 – 2014 the industry average indicators decreased. In general, there is a trend towards a decrease in volume revenue (Picture 2).
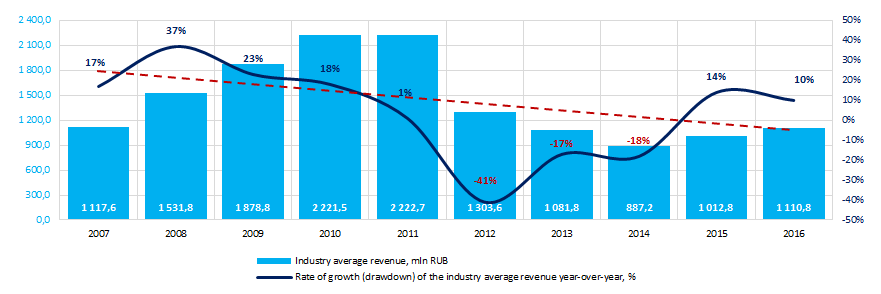 Picture 2. Change in the industry average revenue of companies in the field of power supply activity in 2007 – 2016
Profit and losses
The profit volume of 10 industry leaders in 2016 made 60% of the total profit of TOP-500 companies. The leading position in terms of profit volume in 2016 is taken by RUSENERGOSBYT LLC – one of the largest power supply companies in Russia, delivering electricity to more than 105 000 customers in 60 regions of the country (Picture 3).
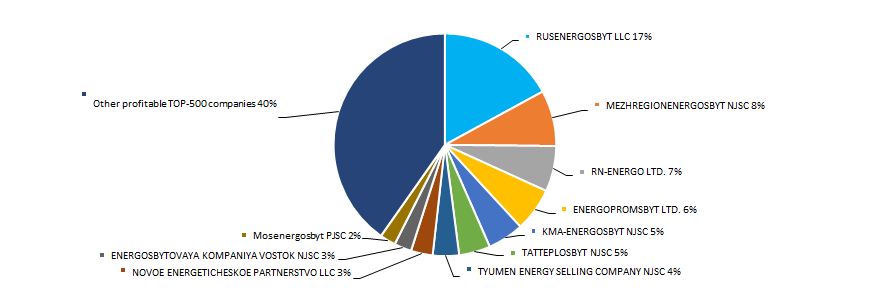 Picture 3. Share of participation of TOP-10 companies in the total volume of profit of TOP-500 enterprises for 2016
Industry average indicators of profit of companies of the industry for the ten-year period are not stable. Negative values of the indicator were observed in 2011 and 2013. In general, profit indicators tend to increase. The industry showed the best results in 2016 (Picture 4).
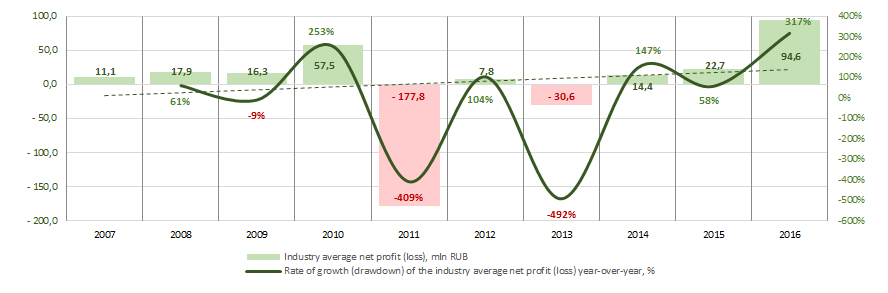 Picture 4. Change in the industry average indicators of profit of companies in the field of power supply activity in 2007 – 2016
Key financial ratios
Over the ten-year period the industry average indicators of the total liquidity ratio were in the range of recommended values – from 1,0 up to 2,0, except the year 2013 (Picture 5). In general, the ratio indicator tends to decrease.
The total liquidity ratio (the relation of the amount of current assets to short-term liabilities) shows the sufficiency of company’s funds for repayment of its short-term liabilities.
The experts of the Information agency Credinform, taking into account the actual situation both in the economy as a whole and in the sectors, has developed and implemented in the Information and Analytical system Globas the calculation of practical values of financial ratios that can be recognized as normal for a particular industry. For companies in the field of power supply activity the practical value of the total liquidity ratio made from 0,77 up to 2,46 in 2016.
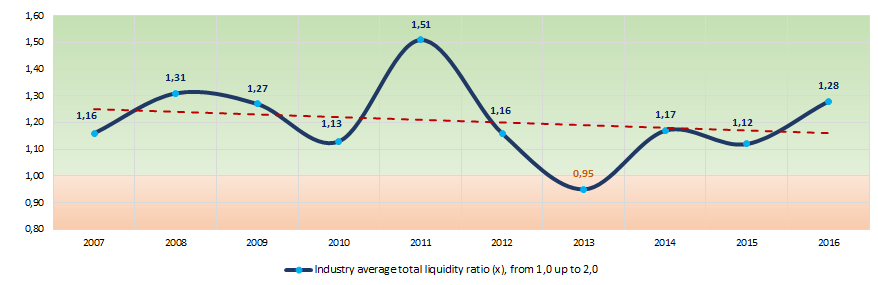 Picture 5. Change in the average industry values of the total liquidity ratio of companies in the field of power supply activity in 2007 – 2016
There has been an instability observed in indicators of the return on investment ratio for ten years, with a tendency to decrease. In 2011 and 2013 the indicators decreased to negative values (Picture 6). The ratio is calculated as the relation of net profit to the sum of own capital and long-term liabilities and demonstrates the return on the equity involved in the commercial activity of own capital and the long-term borrowed funds of an organization.
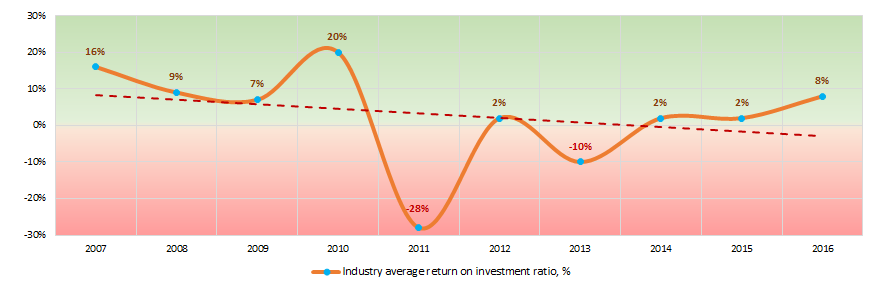 Picture 6. Change in the average industry values of the return on investment ratio of companies in the field of power supply activity in 2007 – 2016
Asset turnover ratio is calculated as the relation of sales proceeds to the average value of total assets for a period and characterizes the efficiency of use of all available resources, regardless of the sources of their attraction. The ratio shows how many times a year a complete cycle of production and circulation is made, yielding profit.
As a whole, this activity ratio showed a tendency to decrease over the ten-year period (Picture 7).
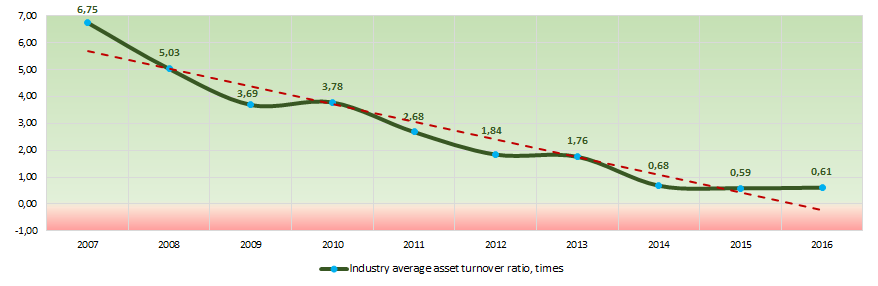 Picture 7. Change in the average industry values of the asset turnover ratio of companies in the field of power supply activity in 2007 – 2016
Main regions of activity
The companies of the industry are unequally distributed across the country. Their largest number is registered in Moscow – the biggest industrial and financial center of the country (Picture 8).
TOP-500 companies are registered in 74 regions of Russia.
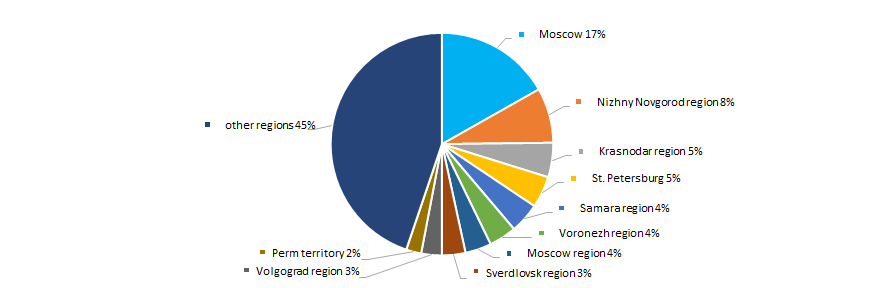 Picture 8. Distribution of TOP-500 companies by regions of Russia
Financial position score
An assessment of the financial position of companies in the industry shows that their the largest number are in a stable financial position and above the average (Picture 9).
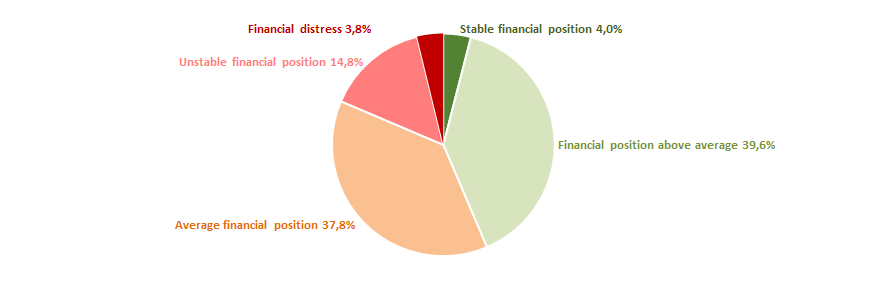 Picture 9. Distribution of TOP-500 companies by financial position score
Liquidity index
Almost half of companies of the industry show an extremely low bankruptcy risk in the short-term period. However, almost a quarter of companies has the highest and above average level of bankruptcy risk (Picture 10).
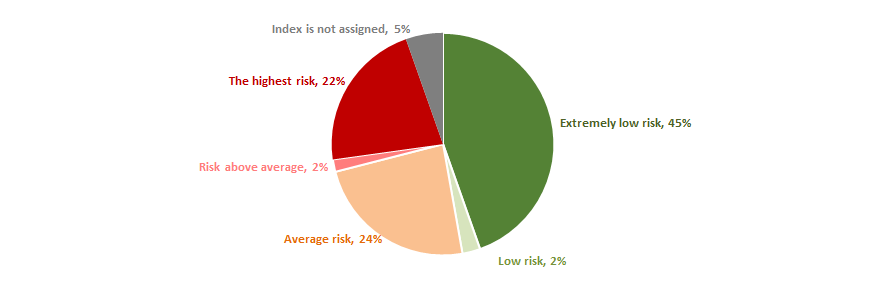 Picture 10. Distribution of TOP-500 companies by liquidity index
Solvency index Globas
Most of TOP-500 companies got Superior/High or Strong/Medium Solvency index Globas, that points to their ability to repay their debts in time and fully (Picture 11).
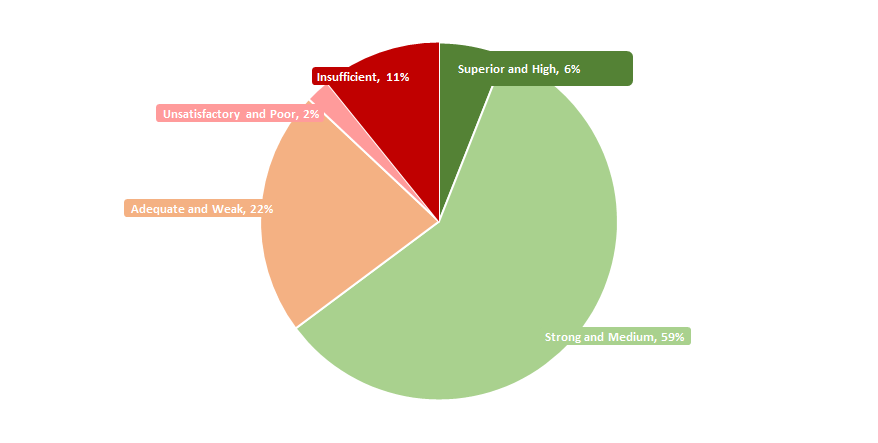 Picture 11. Distribution of TOP-500 companies by solvency index Globas
Thus, a comprehensive assessment of enterprises in the field of power supply activity, taking into account the main indices, financial indicators and ratios, points to relatively favorable trends in the industry, as a whole.