
Order a report
Custom-made industry research, company ratings, competitor analysis


The structure of the russian economy is changing
The Russian companies continue to increase turnover despite of all difficulties in business process. According to the latest financial accounts, total revenue net of VAT, excises and other liabilities exceeds 207 trln RUB (see Picture 1). In the context of absolute values, this figure can be considered as a historical maximum. At the same time, the growth rate of total revenue (year to year) can indicate the efficiency of development and demand model, as well as prices increase, or inflation in other words.
Total revenue of enterprises shows the situation in economy of the state in general. For example, decrease in demand follows the prices increase, and resulted in reduction in revenue that leads to reduction of the GDP. The alike situation was observed at the crisis of 2008-2009 during which gross sales of companies decreased for the first time for several years. Russia overcomes this economic instability more easy than it was expected. It became possible due to floating rate of the national currency caused rouble devaluation that has led to negative import dynamics and improvement of competitive ability of domestic goods.
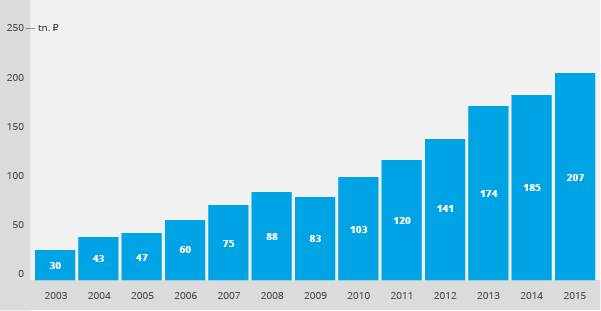 Picture 1. Dynamics of revenue from sale of goods, works and services according to the financial accounts, trln RUB
Distribution of companies by business size
The Russian corporate sector is a field mainly for large business. Corporations holding a monopoly in their industries or segments accumulate about 71% of total revenue. The rest 24% fall for small and micro enterprises and only 5% for medium-sized companies (see Picture 2).
Criteria of classification as a micro-, small- and medium-sized business are established by the orders of the Russian Government. These categories have considerable support from the state: for example, they are statutory privileged participants of procurement procedures. Currently, micro-sized company is an organization with annual revenue up to 120 mln RUB and total stuffing not exceeding 15 employees; small-sized companies have up to 800 mln RUB of revenue and 100 employees, and up to 2 bln RUB of revenue and 250 employees are for medium companies. Other structures are classified as large business.
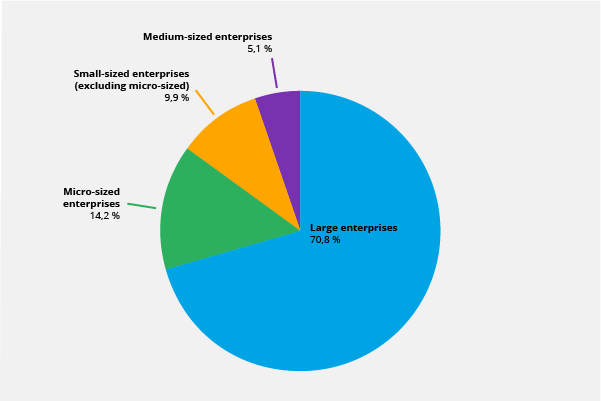 Picture 2. Distribution of total revenue by business size criterion in 2015, %
Distribution of companies by sectors (sectoral structure of the economy)
By reference to analyses of all funds virtually received on settlement or cash account, inference should be drawn that for the past 10 years the structure of domestic economy has underwent significant changes. Nowadays financial activity generates 19% of total earnings on companies’ accounts, when in 2007 the share of this sector not exceeded 0,1%. Speaking about senile industries such as manufacturing, transport and mining, their share is reducing (see pictures 3.1 and 3.2). That is to say Russia is on the way of developed countries where the significant part of the GDP is formed by financial services.
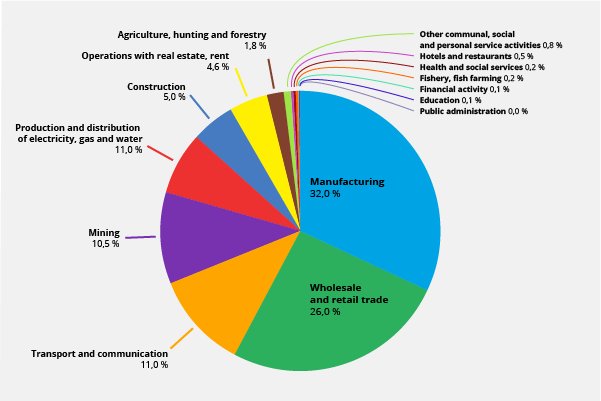 Picture 3.1. Sectoral structure of the economy as of January 1, 2007, %
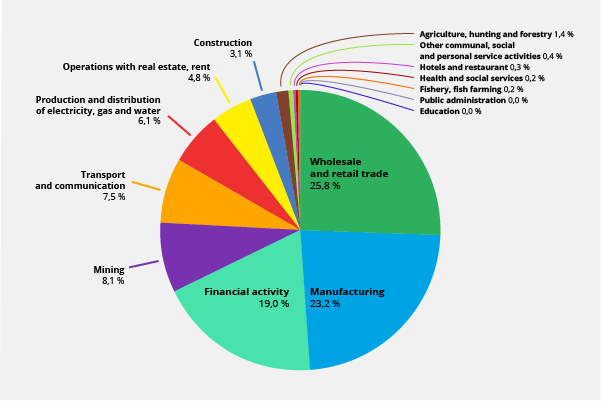 Picture 3.2 Sectoral structure of the economy as of January 1, 2017, %
Distribution of companies by regions
More than 40% of total revenue of all companies is generated in Moscow. Then follows Saint-Petersburg with 8,4% and Moscow region with 5,7% (see Picture 4). Economical imbalance becomes more obvious: almost all large business is registered in Moscow. At the same time its production sites and operating activity are located beyond perimeter of the agglomeration.
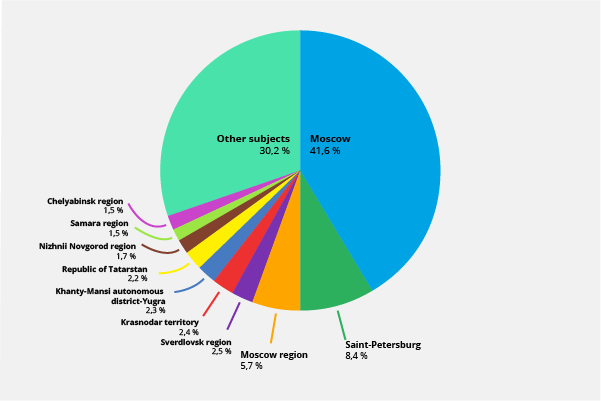 Picture 4. Regional distribution of total revenue of companies in 2015, %
In current conditions the Russian companies face the challenges hardly to be preliminary modeled and forecasted in term of plans and strategies of development. The current 2017 is expected to be as difficult as 2016. Despite of stabilization of world prices for resources and energy products, complicated geopolitical climate and higher volatility on financial and exchange markets still take place.
With a lack of significant growth, the development of certain enterprises can be provided due to competitors’ market shares only. Under current conditions it is going to have to put up with a lack of high profit rate. Also it is necessary to shift the emphasis towards business optimization and increase in labor productivity to keep reliability under conditions of demand stagnation.