Herald
7 important facts about Russian companies

According to the Information and Analytical system Globas, there are 3,1 million operating legal entities in Russia as of August 1, 2021.

We bring to your attention a few of the most important facts that will help you compose an overview of Russian companies.

1. General structure

The majority of the operating legal entities counts for commercial organizations - 2.5 million or 81%. The most common legal form is a limited liability company. The number of registered LLC is 2.4 million. Joint stock companies are a less spread legal form. 48.7 thousand joint-stock companies are registered in Russia, including 41.6 thousand non-public and 6.5 thousand public joint-stock companies. In 2019, there were 67 thousand joint-stock companies in the Russian Federation, since this year the number of joint-stock companies has been constantly decreasing.

The shareholders of operating companies with a controlling stake in the authorized capital of 50% or more are mainly Russian citizens. There are 2,1 million such kind of companies. Citizens of other countries with a share in the capital of more than 50% have established 50 thousand organizations.

2. Region of registration

Moscow remains the leader in terms of the number of registered legal entities. As of August 1, 2021, over 520 thousand legal entities were registered in the capital of our country, St. Petersburg is in the second place with 208 thousand registered companies, Moscow region closes the top with 178 thousand companies. The share of the three regions of the total number of operating companies exceeds 29%.
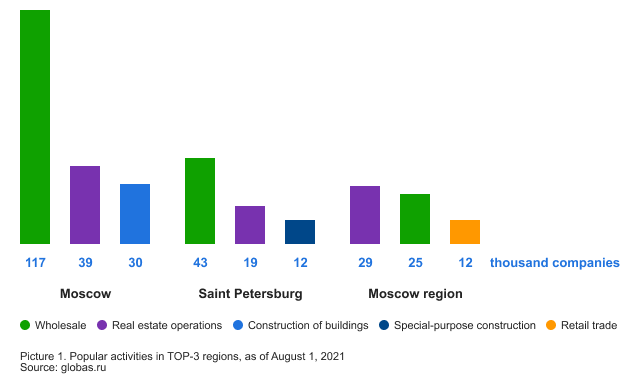
3. Activity types

Most of the companies are engaged in wholesale and real estate transactions. These sectors are the most popular in Moscow, St. Petersburg and Moscow region (Picture1). The largest number of construction and development companies is registered in St. Petersburg and Moscow too.

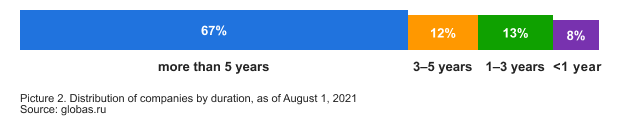
4. Companies’ duration

The significant part of operating companies have passed the formation period: 67% of organizations were founded more than 5 years ago (Picture 2). The share of newly established companies from 1 to 3 years is 13%. In 2020, a large number of new companies could not survive the decline in the level of business activity: 110 thousand legal entities with duration from 1 to 3 years ceased their activities.

5. Business categories

2.1 million operating companies refer to small and medium-sized businesses, and 1,9 million companies are micro-enterprises.

6. Result of activity

Most of the companies in Russia show positive financial result: in 2020, the share of profitable companies was 75%. The share of unprofitable ones is 25%.

7. Globas index

According to Globas, 30% of operating companies have Superior / High and Strong / Medium solvency index, 47% have Adequate / Weak solvency index, and 11% have Unsatisfactory / Poor solvency index.

7 conclusions from 7 facts
  • Russian business remains fairly closed. Entrepreneurs make a choice in favor of non-public legal form.
  • There is a high concentration of business in the capital and its environs.
  • The majority of Russian companies are engaged in trade.
  • The backbone of Russian business is mature enterprises that have experienced several economic shocks and crises. Young companies were unable to overcome the difficulties of 2020, and their share in the total number of operating organizations decreased.
  • Despite the large number of small enterprises, Russia is a country of large companies, in which the bulk of GDP is provided by the largest taxpayers.
  • About 75% of companies turned out to be profitable by the results of 2020, and only a third were unprofitable.
  • The profitability of a company does not always guarantee solvency. Only a third of companies meet the requirements of Superior / High and Strong / Medium solvency index.
Ranking
Metalworking companies in Yekaterinburg

Information agency Credinform has prepared a ranking of metalworking enterprises in Yekaterinburg. Companies engaged in manufacture of fabricated metal products (TOP-10) in terms of annual revenue were selected according to the data from the Statistical Register and the Federal Tax Service for the available periods (2018 - 2020). Then the companies were ranged by product profitability ratio (Table 1). The selection and analysis of companies were based on the data from the Information and Analytical system Globas.

Product profitability (%) is calculated as the ratio of sales profit to expenses for ordinary activities.

Profitability reflects the economic efficiency of production. Analysis of the product profitability provides us with the feasibility of goods production. There are no recommended values for indicators of this group, as they vary greatly depending on the industry.

In order to get the most comprehensive and fair picture of the financial standing of an enterprise, it is necessary to pay attention to all the combination of financial indicators and company’s ratios.

Table 1. Net profit, revenue, product profitability, solvency index Globas of metalworking enterprises in Yekaterinburg (ТОP-10)
Name, INN, type of activity Revenue, million RUB Net profit (loss), million RUB Product profitability, % Solvency index Globas
2019 2020 2019 2020 2019 2020
1 2 3 4 5 6 7 8
JSC URAL SIBERIAN INDUSTRIAL COMPANY
INN 6673128630
manufacture of other fabricated metal products n.e.c.
down1 057,5 up4 629,6 down-37,5 up889,9 down3,28 up33,98 233 Strong
JSC VIZ
INN 6658019241
manufacture of sinks, wash basins, baths and other sanitary ware and their components from ferrous metals, copper or aluminum
up1 632,0 up1 707,1 down396,6 down369,2 down23,20 up29,18 209 Strong
AO UMECON
INN 6660000590
manufacture of metal structures and products of their parts
down2 338,8 up2 392,1 down102,0 up309,2 down6,79 up19,41 192 High
NAO URALCHERMET
INN 6672333153
treatment and coating of metals
down2 184,7 down1 880,4 up40,1 up58,3 up7,65 up9,46 242 Strong
OOO NPO LEGION
INN 6686020432
manufacture of constructional metal products
up843,2 up939,0 up9,8 up27,5 up6,58 up8,08 269 Medium
AO PK TT
INN 7422035050
manufacture of steel bars and solid sections of steel by cold drawing
up722,6 up944,2 up10,5 up23,8 down4,01 up7,87 222 Strong
OOO PERVAYA KROVELNAYA
INN 6671330135
machining
down738,2 up1 085,8 up11,5 up24,5 down2,46 up3,45 222 Strong
OOO STALTRANS
INN 6672159201
manufacture of wire products and springs
up1 927,5 down1 823,0 down4,3 down3,7 up1,82 up2,30 258 Medium
NAO NIZMK
INN 6664003916
manufacture of other metal products
up1 130,7 up1 185,9 down11,9 up33,4 down0,50 down-0,52 232 Strong
OOO TPK
INN 6673240159
treatment and coating of metals
up1 838,9 down1 785,0 up105,4 down9,8 up14,38 down-1,29 219 Strong
Average value for TOP-10 companies down1 441,4 up1 837,2 down65,5 up174,9 down7,07 up11,19  
Average value for TOP-100 companies down455,1 up489,3 down18,1 up24,2 up7,12 down5,20  
Average industry value up76,2 up85,0 up6,2 down5,5 down7,26 up9,40  

вверх improvement compared to prior period, вниз decline compared to prior period

The average values of the product profitability ratio of TOP-10 are above and of TOP-100 - below the average industry value in 2020. Two companies of TOP-10 decreased their values in 2020, comparing to the previous period, whereas in 2019 the decrease was recorded for six companies.

At the same time, in 2020 seven companies increased the revenue and / or net profit. The average revenue in TOP-10 increased by 27%, in TOP-100 – almost by 8%, average industry value increased almost by 12%. The average profit in TOP-10 increased almost by factor of 2,7, in TOP-100 – by 34%, but the average industry value decreased by 11%.

In general, during last 5 years, the average industry values of the product profitability ratio were increasing during two periods. The best value was registered in 2020, the worst - in 2016 and 2017 (Picture 1).

Picture 1. Change in average industry values of product profitability of metalworking enterprises in Yekaterinburg in 2016 – 2020 Picture 1. Change in average industry values of product profitability of metalworking enterprises in Yekaterinburg in 2016 – 2020