
Order a report
Custom-made industry research, company ratings, competitor analysis


Debts and assets of social services
Information agency Credinform has prepared a ranking of the largest social service companies in Russia. The companies rendering social services to senior citizens and disabled people, providing child and social care etc. (TOP-10) with the largest annual revenue were selected for the ranking, according to the data from the Statistical Register and Federal Tax Service for the latest available accounting periods (2017 - 2019). Then the enterprises were ranked by the debt-to-assets ratio (Table 1). The analysis was based on the data from the Information and Analytical system Globas.
Debt-to-assets ratio indicates the share of the company’s assets being financed by loans. Standard value of the ratio is from 0.2 to 0.5.
Sales revenue and net profit demonstrate a company’s size and its business efficiency, and debt to solvency ratio indicates the risk of insolvency.
A value that exceeds the maximum standard value indicates an excessive loan overburden that may facilitate development, but as well may have a negative impact on stability of corporate funds. A value lower than the minimum standard value may speak of a conservative financial management strategy and of an excessive caution in raising new debt funds.
In order to get the most comprehensive and fair picture of the financial standing of an enterprise it is necessary to pay attention to all combination of financial indicators and company’s ratios.
| Name, INN, region | Revenue, million RUB | Net profit (loss), million RUB | Debt-to-assets ratio (x), from 0,2 to 0,5 | Solvency index Globas | |||
| 2018 | 2019 | 2018 | 2019 | 2018 | 2019 | ||
| 1 | 2 | 3 | 4 | 5 | 6 | 7 | 8 |
| BF NO BLAGOTVORITELNYI FOND PODDERZHKI VETERANOV TRUDA NADEZHDA INN 7714321154 Moscow |
|
|
|
|
|
|
257 Medium |
| OOO PROSPEKT INN 6229063499 Ryazan region |
|
|
|
|
|
|
196 High |
| OOO DOBROE DELO INN 7733241842 Moscow |
|
|
|
|
|
|
231 Strong |
| OOO UPRAVLYAYUSHCHAYA KOMPANIYA NOVOLETIYE INN 5904182219 Perm krai |
|
|
|
|
|
|
173 Superior |
| OOO GALOKOM INN 7733806570 Moscow |
|
|
|
|
|
|
248 Strong |
| OOO MEDFARMA-SERVIS INN 3525255572 Vologda region |
|
|
|
|
|
|
185 High |
| OOO GARMONIYA INN 7840317422 Saint Petersburg |
|
|
|
|
|
|
191 High |
| OOO CENTR PROEKTIROVANIYA OBUVI SPETSIALNOGO NAZNACHENIYA ORTOMODA INN 7718195662 Moscow |
|
|
|
|
|
|
254 Medium |
| ANO EKSPERTNY INSTITUT SOTSIALNYKH ISSLEDOVANII INN 7703424479 Moscow |
|
|
|
|
|
|
262 Medium |
| OOO DOVERIYE INN 6168004976 Rostov region |
|
|
|
|
|
|
234 Strong |
| Average value for TOP-10 | |
|
|
|
|
|
|
| Industry average value | |
|
|
|
|
|
|
![]() improvement compared to prior period,
improvement compared to prior period, ![]() decline compared to prior period
decline compared to prior period
Average value of debt-to-assets ratio of TOP-10 companies is lower than the average industry one. Two companies have the standard value in 2019.
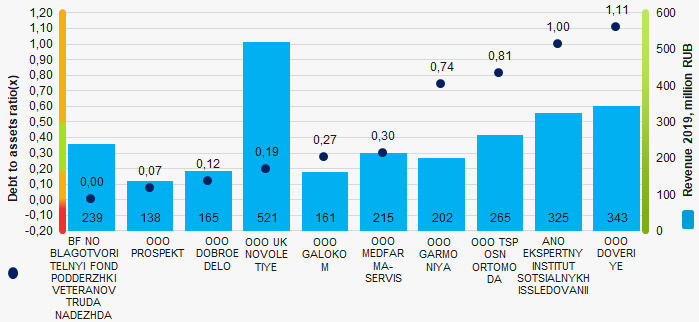 Picture 1. Debt-to-assets ratio and revenue of the largest social service companies in Russia (TOP-10)
During the decade, average industry values of debt-to-assets ratio were on the whole beyond the limits of the standard value and had a tendency to improve (Picture 2)
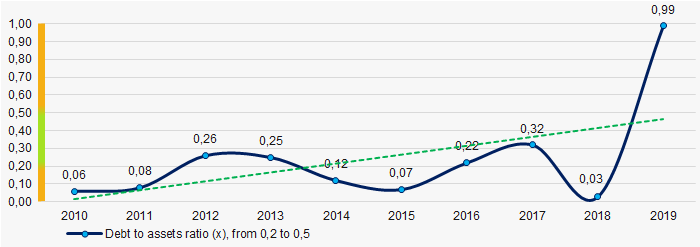 Picture 2. Change of industry average values of debt-to-assets ratio of social service companies in Russia in 2010 – 2019