
Order a report
Custom-made industry research, company ratings, competitor analysis


TOP 1000 of the largest companies in Kazan
Information agency Credinform represents a review of activity trends among the companies in Kazan.
The largest companies with the highest annual revenue (TOP 1000) were selected for the ranking, according to the data from the Statistical Register and the Federal Tax Service for the latest available periods (2016 – 2020). The selection and analysis of companies were based on the data of the Information and Analytical system Globas.
Net assets are total assets less total liabilities. This indicator reflects the real value of the property of an enterprise. When the company’s debt exceeds the value of its property, the indicator is considered negative (insufficiency of property).
The largest company in term of net assets is LLC TELECOM-MANAGEMENT, INN 1655061006, investment in securities. In 2020, net assets value of the company almost amounted to 237 billion RUB.
The lowest net assets value among TOP 1000 belonged to JSC KAZSTROYINVEST, INN 1660054950, rental and management of own or leased real estate. In 2020, insufficiency of property of the enterprise was indicated in negative value of -8 billion RUB.
Covering the five-year period, the average net assets values of TOP 100 have a trend to increase with the decreasing growth rate (Picture 1).
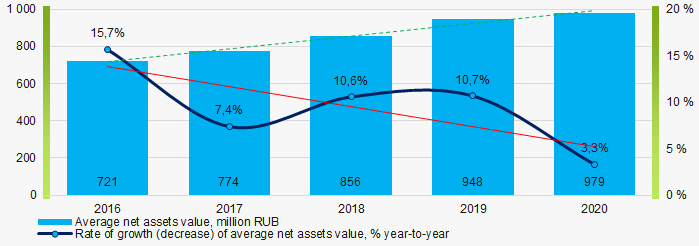 Picture 1. Change in average net assets values in 2016 – 2020
Over the past five years, the share of companies with insufficient property had a negative trend to increase (Picture 2).
 Picture 2. Shares of TOP 1000 companies with negative net assets value in 2016-2020
Sales revenue
In 2020, the revenue volume of ten largest companies was 38% of total TOP 1000 revenue (Picture 3). This is indicative of a relatively high level of capital concentration among companies in Kazan.
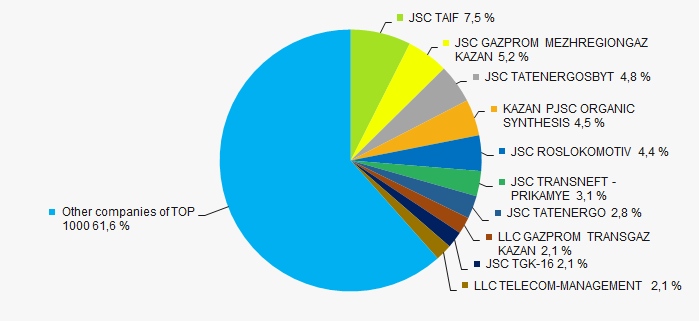 Picture 3. The share of TOP 10 companies in total 2020 revenue of TOP 1000
In general, there is a trend to increase in revenue with the decreasing growth rate (Picture 4).
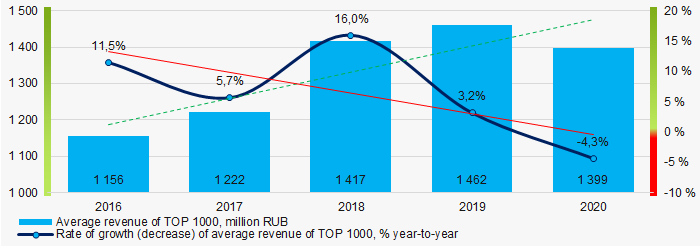 Picture 4. Change in average revenue in 2016 – 2020
Profit and loss
In 2020, the largest organization in term of profit was KAZAN PJSC ORGANIC SYNTHESIS, INN 1658008723, manufacture of plastics and synthetic resins in primary forms. The company’s profit almost amounted to 9 billion RUB. Covering the five-year period, there is a trend to decrease in average net profit and growth rate (Picture 5).
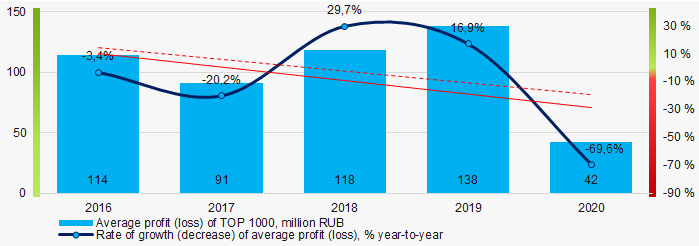 Picture 5. Change in average profit (loss) values of TOP 1000 in 2016 – 2020
For the five-year period, the average profit of TOP 1000 have the decreasing trend with the increasing net loss (Picture 6).
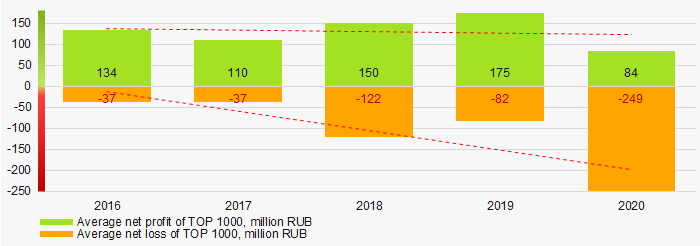 Picture 6. Change in average net profit and net loss of ТОP 1000 in 2016 - 2020
Key financial ratios
Covering the five-year period, the average values of the current liquidity ratio were above the recommended one - from 1,0 to 2,0 with a trend to decrease (Picture 7).
Current liquidity ratio (current assets to short-term liabilities) shows the sufficiency of company’s assets to repay on short-term liabilities.
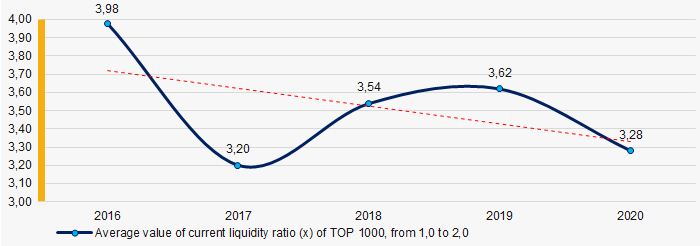 Picture 7. Change in industry average values of current liquidity ratio of TOP 1000 in 2016 – 2020
 Covering the five-year period, the average values of ROI ratio had a trend to decrease (Picture 8).
ROI ratio is calculated as net profit to sum of shareholders equity and long-term liabilities, and shows the return of equity involved in commercial activities and long-term borrowed funds.
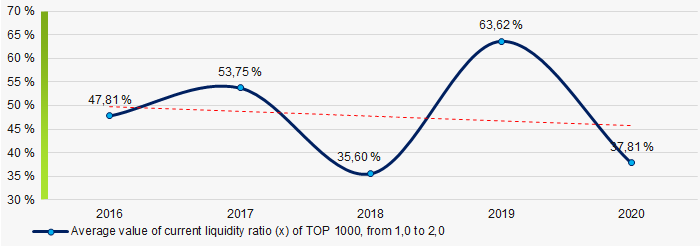 Picture 8. Change in industry average values of ROI ratio of TOP 1000 in 2016 - 2020
Assets turnover ratio is the ratio of sales revenue and company’s average total assets for a period. It characterizes the effectiveness of using of all available resources, regardless the source of their attraction. The ratio shows how many times per year the full cycle of production and circulation is performed, generating the corresponding effect in the form of profit.
Covering the five-year period, business activity ratio demonstrated the decreasing trend (Picture 9).
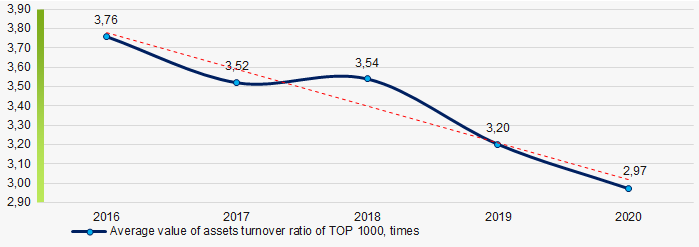 Picture 9. Change in average values of assets turnover ratio of TOP 1000 in 2016 – 2020
Small business
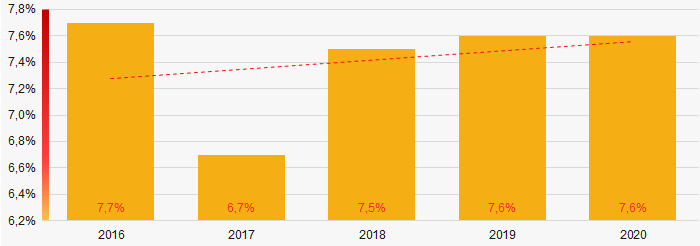
77% of companies of TOP 1000 are registered in the Register of small and medium-sized enterprises of the Federal Tax Service of the Russian Federation. In 2020, their share in total revenue of TOP 1000 is 19,6%, slightly lower than the average country values in 2018-2019 (Picture 10).
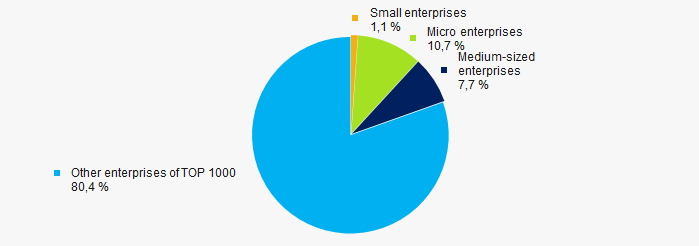 Picture 10. Shares of small and medium-sized enterprises in TOP 1000
Financial position score
Assessment of the financial position of TOP 1000 companies shows that the financial position of the majority of them is above average (Picture 11).
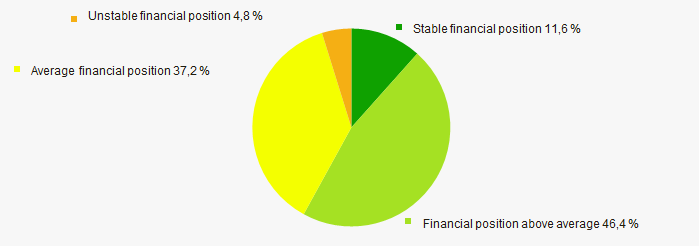 Picture 11. Distribution of TOP 1000 companies by financial position score
Solvency index Globas
Most of TOP 1000 companies got Superior / High and Strong / Medium indexes Globas. This fact shows their limited ability to meet their obligations fully (Picture 12).
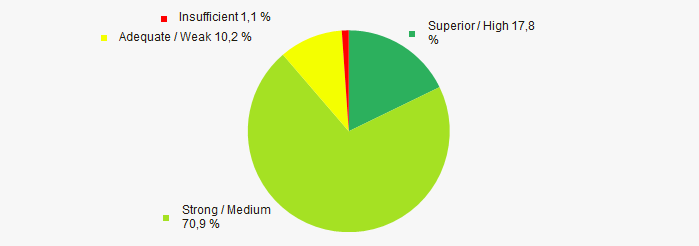 Picture 12. Distribution of TOP 1000 companies by solvency index Globas
Conclusion
Complex assessment of activity of largest companies in Kazan, taking into account the main indexes, financial ratios and indicators, demonstrates the prevalence of positive trends in their activities in 2016 - 2020 (Table 1).
| Trends and evaluation factors | Relative share of factors, % |
| Dynamics of the average net assets value | |
| Rate of growth (decrease) in the average size of net assets | |
| Increase (decrease) in the share of enterprises with negative values of net assets | |
| Level of competition / monopolization | |
| Dynamics of the average revenue | |
| Rate of growth (decrease) in the average size of revenue | |
| Dynamics of the average profit (loss) | |
| Rate of growth (decrease) in the average profit (loss) | |
| Growth / decline in average values of companies’ net profit | |
| Growth / decline in average values of companies’ net loss | |
| Increase / decrease in average values of total liquidity ratio | |
| Increase / decrease in average values of return on investment ratio | |
| Increase / decrease in average values of asset turnover ratio, times | |
| Share of small and medium-sized businesses in terms of revenue being more than 20% | |
| Financial position (the largest share) | |
| Solvency index Globas (the largest share) | |
| Average value of relative share of factors | |
![]() positive trend (factor),
positive trend (factor), ![]() negative trend (factor)
negative trend (factor)