Order a report
Custom-made industry research, company ratings, competitor analysis


Return on sales of the largest Russian companies engaged in the building materials trade
Information agency Credinform offers the ranking on the return on sales of the largest Russian companies engaged in the building materials trade.
The largest Russian enterprises (TOP-10), working it the market of building materials trade, were selected on the volume of revenue for the ranking, according to the data from the Statistical Register for the latest available period - for 2015. Then they were ranked by decrease in return on sales ratio.
Return on sales (%) is calculated as the share of operating profit in the company's sales volume. The return on sales ratio characterizes the efficiency of industrial and commercial activity of an enterprise and shows how much money remains by an enterprise in the result of the sale of products after covering its costs, payment of taxes and loans interest’s expense.
Return on sales is an indicator of the efficiency of company’s pricing policy and its ability to control costs. The differences in competitive strategies and product lines cause significant variety of return on sales values in companies of the same industry. That is why it should be noted that at equal values of revenues, operating expenses and pre-tax profit in two different organizations the return on sales can vary greatly under the influence of the volume of interest payments on the net profit margin.
For getting of the most comprehensive and fair picture of the financial standing of an enterprise it is necessary to pay attention to all available combination of ratios, financial and other indicators.
| Name, INN, region | Net profit for 2015, mln RUB | Revenue for 2015, mln RUB | Revenue for 2015 by 2014, (growth/ reduction), % | Return on sales, % | Solvency index Globas-i |
|---|---|---|---|---|---|
| KRAUTS LLC INN 7728865059 Moscow |
4 310,9 | 10 404,1 | 150,0 | 41,44 | 196 The highest |
| DENEB LLC INN 5047103554 Moscow region |
552,9 | 7 858,1 | -7,7 | 21,15 | 229 High |
| TORGOVYI DOM PALITRA LLC INN 5012022008 Moscow region |
271,0 | 6 785,3 | 28,4 | 6,30 | 180 The highest |
| STROITELNYI TORGOVYI DOM PETROVICH LLC INN 7802348846 Saint-Petersburg |
1 093,5 | 23 394,3 | 17,2 | 4,70 | 190 The highest |
| STROIFORMAT LLC INN 7810024468 Leningrad region |
39,6 | 7 270,2 | - (*) | 4,62 | 550 Unsatisfactory |
| DOMSTROIKOMPLEKTATSIYA LLC INN 7714916151 Moscow |
210,2 | 8 323,4 | 36,6 | 4,57 | 234 High |
| NV-TRADE LLC INN 2315171300 Moscow |
21,8 | 9 240,1 | 13,8 | 2,40 | 264 High |
| TD PARTNER JSC INN 7704602692 Moscow |
27,1 | 4 670,7 | -11,2 | 2,34 | 246 High |
| TECHNONIKOL LTD INN 3811066336 Irkutsk region |
47,1 | 4 323,2 | -35,2 | 1,76 | 261 High |
| RDS Stroy LLC INN 7710452533 Moscow |
13,9 | 6 157,8 | 3,0 | 0,37 | 252 High |
(*) – calculation of the relation of revenue of STROIFORMAT LLC for 2014 – 2015 is not given due to the lack of company’s financial statement for 2014 in the state statistics authorities
The average value of the return on sales ratio in the group of TOP-10 companies amounted to 8,97 in 2015. The same indicator in the group of the TOP-100 companies was 4,7, by the industry average value of 5,09.
Nine companies from the TOP-10 got the highest and high solvency index Globas-i, that points to their ability to repay their debts in time and fully.
STROIFORMAT LLC got unsatisfactory solvency index Globas-i, due to the claim for recognition of the company bankrupt submitted in June 2016 and for the participation as a defendant in arbitration court proceedings in terms of debt collection.
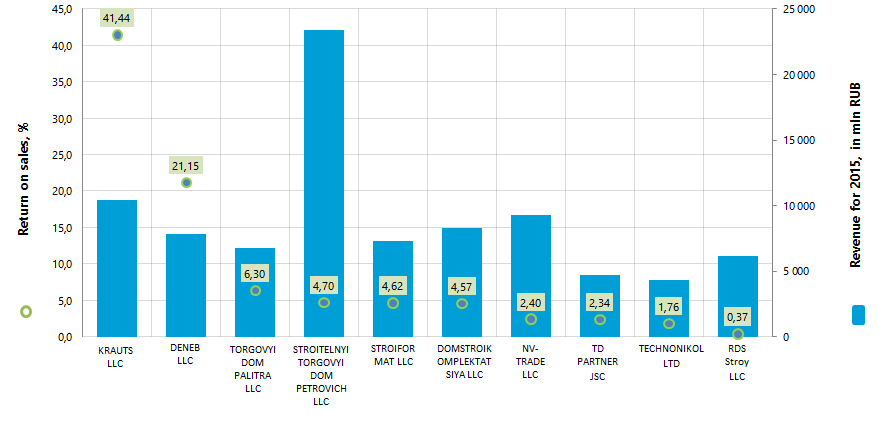
The total revenue of the TOP-10 enterprises amounted to 88,4 bln RUB in 2015, that is by 16% more than in 2014 on the comparable range of companies. At the same time, the total net profit in the same group increased more than 3 times. Three organizations from the TOP-10 (highlighted in red in Table 1) allowed a decrease in the value of net profit and (or) in revenue in 2015 compared with the previous period.
In the group of the TOP-100 enterprises an increase in the total revenue for the same period amounted to 41% on the comparable range of companies, by an increase in total net income by 13%.
There are positive values of the return on sales ratio observed by all TOP-10 companies, as well as in industry in general. It points to a relatively high efficiency of work of the industry. However, there has been a trend towards a slowdown in growth in the industry in recent years, as evidenced by the calculated figures (Picture 2) on the basis of the data of the Federal State Statistics Service.
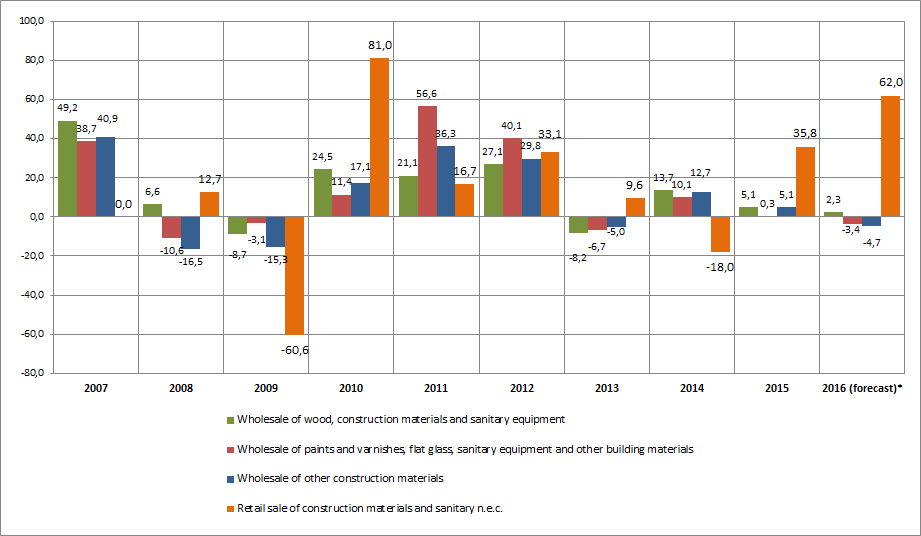
(*) forecast for 2016 is calculated based on the average rate of growth (decline) for 2014-2015 and for 6 months 2015-2016
As the graph shows, the sales proceeds in the given types of trade are largely dependent on the macroeconomic environment. At the same time, according to the same data of Rosstat, there is a significant increase in sales proceeds observed from 2006 till 2015. Thus, Thus, in the wholesale of wood, construction materials and sanitary equipment, paints and varnishes, flat glass and other building materials - the growth rate is 3 times. In the wholesale of other construction materials - an increase of 2,3 times, and in the retail trade with building materials - an increase of 1,5 times.
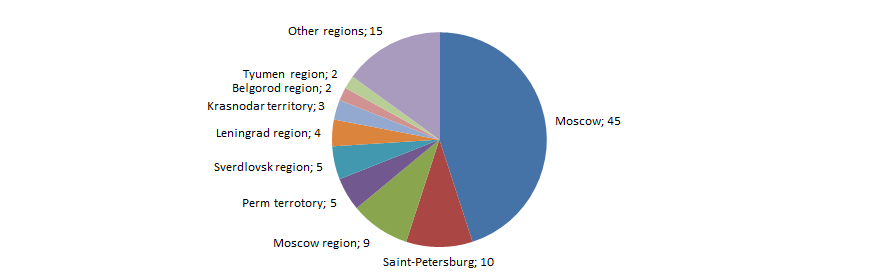
Companies engaged in the building materials trade largely tend to the major cities - Moscow and Saint-Petersburg. This is confirmed by the Information and analytical system Globas-i, according to which 100 the largest enterprises engaged in the building materials in terms of revenue for 2015 are concentrated in 23 regions of Russia.