Ranking
Accounts payable turnover of the largest Russian leasing companies

Information agency Credinform prepared a ranking of Russian leasing companies. The enterprises with the largest volume of revenue (TOP-10) were selected for the ranking, according to the data from the Statistical Register for the latest available periods (for 2014 and 2015). Then they were ranked by accounts payable turnover (Table 1).

Accounts payable turnover (times in a year) is calculated as the relation of average accounts payable for the period to sales revenue. The ratio shows how many times a year an enterprise has discharged the average amount of its accounts payable.

This indicator reflects the process of debt repayment to contractors (partners, suppliers, mediators etc.). The coefficient determines the number of firm's closed debts and is calculated to estimate cash flows. It allows to draw conclusions about the effectiveness of company’s work and chosen financial strategy.

The higher is the ratio value, the soonest an enterprise settles accounts with its suppliers. Reduction of turnover can mean as well problems with payment of invoices, as more effective organization of relationships with suppliers, which provides a more profitable, deferred payment schedule and uses accounts payable as a source of cheap financial resources.

The specialists of the Information agency Credinform, taking into account the actual situation both in the economy as a whole and in the sectors, has developed and implemented in the Information and Analytical system Globas-i the calculation of practical values of financial ratios, which can be recognized as normal for a particular industry. For leasing companies the practical value of the accounts payable turnover is up to 338,29 times.

For getting of the most comprehensive and fair picture of the financial standing of an enterprise it is necessary to pay attention to all available combination of company’s financial indicators and ratios.

Table 1. Net profit, revenue, accounts payable turnover, solvency index Globas-i® of the largest Russian leasing companies (TOP-10)
Name, INN, regionNet profit (loss) for 2015, mln RUBRevenue for 2015, mln RUBRevenue for 2015, by 2014, +/- %Accounts payable turnover, times in 2015Solvency index Globas-i®
SPETSNEFTETRANS LLC
INN 7743712642 Moscow
888,1 4 500,3 78 3 059,19 272
High
PAO ROSAGROLIZING
INN 7704221591 Moscow
-9 679,1 3 258,1 13 847,41 228
High
NITROKHIMPROM LLC
INN 7718196987 Moscow
170,6 3 320,6 2 138 541,80 221
High
RN-AIRCRAFT LLC
INN 7706734415 Moscow
6 540,9 8 649,2 57 110,16 242
High
RAIL1520 LLC
INN 7801537819 Leningrad region
661,2 8 172,5 116 82,90 297
High
NAO PROMTRANSINVEST
INN 7730714748 Moscow
604,4 8 189,2 220 62,21 227
High
TATNEFT – AKTIV LLC
INN 1644013875 Republic of Tatarstan
129,4 2 727,1 28 41,11 199
The highest
BRANSVIK REIL LLC
INN 7705872331 Moscow
-4 435,7 7 271,8 -2 35,73 307
Satisfactory
GTI MENEDZHMENT LLC
INN 7701409186 Moscow
591,2 3 096,4 182 35,62 266
High
AGGREKO EURASIA LLC
INN 7705838531 Tyumen region
962,6 2 879,3 40 30,52 189
The highest
Total in the group of TOP-10 companies -3 566,4 52 064,4 *73 **219,62  
Total in the group of TOP-100 companies -5 419,1 118 128,5 *38 **168,67  
Industry average value/strong> -0,6 25,7 -9 299,38  
* - group average value
** - group average value without extreme values

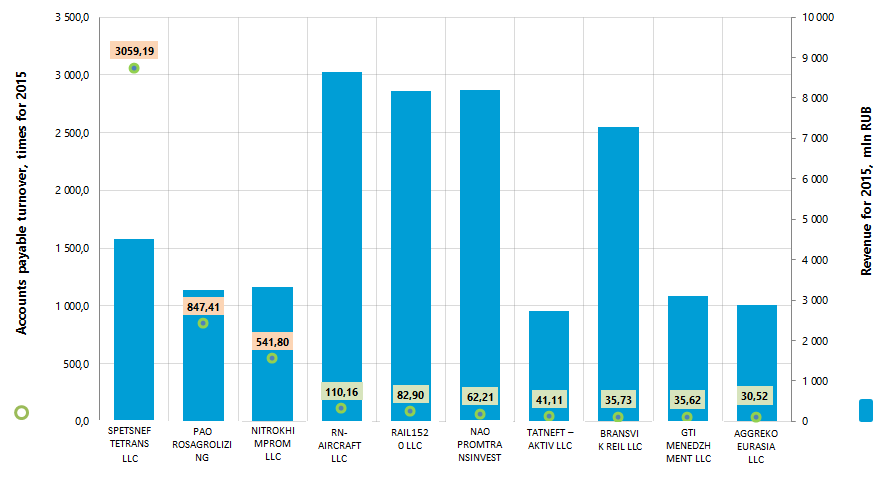
The average values of accounts payable turnover in 2015 as well in the group of TOP-10, as in the group TOP-100 companies stay within parameters of the practical value. However, three from TOP-10 companies (marked with a yellow filling in Table 1 and in Picture 1) have not met these parameters.

Accounts payable turnover and revenue of the largest Russian leasing companies (TOP-10)
Picture 1. Accounts payable turnover and revenue of the largest Russian leasing companies (TOP-10)

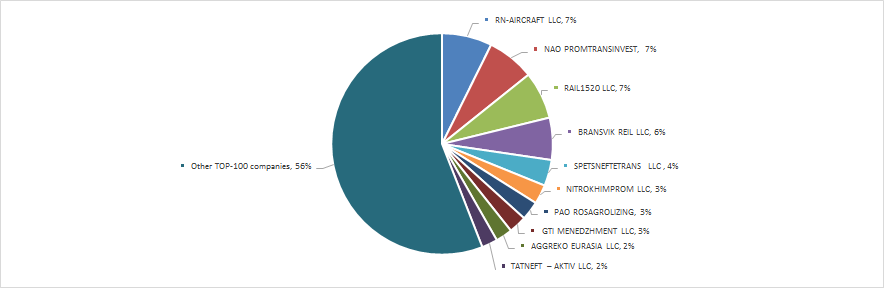
The volume of revenue of 10 the largest companies is 44% of the total revenue of 100 the largest enterprises. It points to a relatively high level of monopolization in this industry. Thus, the shares of the largest firms in terms of revenue in 2015 made 21% in the total revenue of the group of TOP-100 companies. (Picture 2).

Shares of TOP-10 enterprises in the total revenue of the group of TOP-100 companies for 2015, %
Picture 2. Shares of TOP-10 enterprises in the total revenue of the group of TOP-100 companies for 2015, %

Nine from TOP-10 companies got the highest or high solvency index Глобас-i®U, that points to their ability to repay their debts in time and fully.

BRANSVIK REIL LLC got satisfactory solvency index Глобас-i® due to the information on its participation as a defendant in arbitration court proceedings in terms of debt collection, on cases of untimely fulfillment of its obligations, as well as the loss in the structure of balance sheet indicators. The forecast for index development is stable.

Three from TOP-10 companies have reduced indicators of revenue in 2015 compared to the previous period or have a loss (are marked with red filling in Table 1).

In the group of TOP-100 companies there were 27 unprofitable companies in 2014, and in 2015 their number decreased to 25.

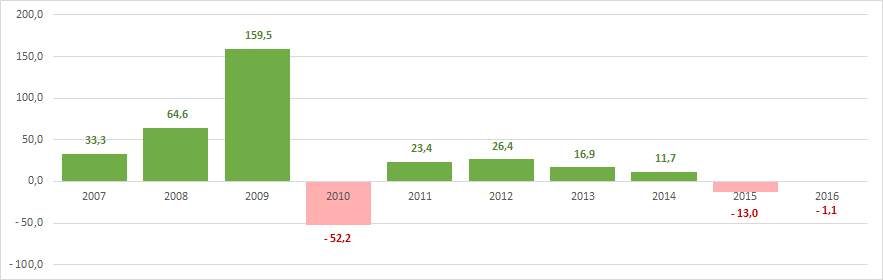
The indicators of Russian leasing companies in monetary terms have not been stable in recent years and are under pressure of the macroeconomic situation in the economy as a whole, that is confirmed by the data of the Federal State Statistics Service (Picture 3 и Table 2).

Growth rates (rates of drawdown) of the total revenue of Russian leasing companies from year to year, %
Picture 3. Growth rates (rates of drawdown) of the total revenue of Russian leasing companies from year to year, %

In 2016 the largest revenue was by companies, renting various machines and equipment, household products and personal demand items, and the least – by firms, renting commercial equipment.

Table 2. Revenue (nett) from the sale of leasing services (net of value added tax, excises and other similar obligatory payments), thousand rubles.
Leasing of:2010 г.2011 г.2012 г.2013 г.2014 г.2015 г.2016 г.
of machines and equipment without an operator; leasing of household goods and personal demand items 63 467 670 77 222 139 88 113 719 108 117 783 121 148 285 103 362 858 104 108 554
of other machines and equipment 25 264 865 25 433 896 47 951 336 50 196 942 62 816 332 32 490 160 40 497 161
of other vehicles and equipment 15 706 913 25 300 835 35 119 421 49 848 191 49 013 587 55 432 777 39 723 982
of other land vehicles and equipment 15 043 107 24 398 446 34 275 436 48 822 363 47 422 878 54 864 194 38 113 449
of other motor vehicles and equipment 11 841 822 11 196 123 16 619 904 37 801 692 24 444 882 16 996 705 24 158 204
of cars 21 993 809 26 039 448 4 420 659 7 048 439 8 622 268 14 728 340 23 127 046
construction machines and equipment with an operator 13 125 243 12 682 238 15 288 568 12 835 733 13 873 017 11 880 186 19 554 487
construction machines and equipment 4 367 491 5 129 657 21 907 065 33 184 819 45 563 304 12 229 349 17 663 857
of other machines and equipment n.e.c. 15 719 453 16 401 560 20 240 909 12 335 964 12 940 284 14 499 193 17 462 162
of marine vehicles with crew; provision of switching and shunting 844 300 1 909 186 2 715 643 2 577 702 7 779 949 9 509 885 16 470 901
of railway transport and equipment 3 201 285 13 202 323 17 655 532 11 020 671 22 109 752 31 719 497 13 240 146
of other machines and equipment of scientific and industrial purpose 14 607 391 12 256 677 13 945 837 6 852 309 11 276 546 11 074 771 10 588 322
agricultural machinery and equipment 4 180 878 2 884 220 4 718 951 4 543 027 4 224 450 5 715 931 5 012 810
of cargo motor transport with an driver 2 740 842 4 939 978 3 949 999 3 865 291 4 344 440 5 416 675 4 239 681
of air vehicles and equipment 192 422 260 913 194 394 114 708 77 536 60 226 1 123 294
of water vehicles and equipment 471 384 641 476 649 591 700 782 1 297 544 186 218 487 239
of mining and oilfield equipment 555 962 4 137 040 6 247 895 1 651 801 258 833 403 6208 398 153
office machines and equipment, including computing hardware 997 043 1 018 459 1 084 411 131 762 88 294 45 687 358 332
shop equipment 400 750 4 889 5 811 7 103 6 213 6 523 6 683
*) In Table 3 the red filling marks the decline in revenue, green filling – the growth.

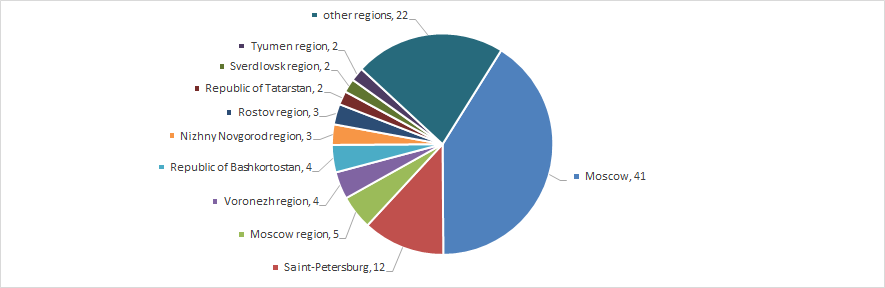
The leasing enterprises are distributed unevenly throughout the country, leaning toward two the biggest cities, where the largest financial resources are concentrated. This is confirmed by data of the Information and Analytical system Глобас-i, according to which 100 the largest companies in terms of revenue for 2015 are registered in 32 regions of Russia (Picture 4).

Distribution of 100 the largest leasing enterprises by regions of Russia
Picture 4. Distribution of 100 the largest leasing enterprises by regions of Russia
Ranking
Assets turnover of the largest Russian manufacturers of dairy products

Information Agency Credinform has prepared the ranking of the largest Russian manufacturers of dairy products. The largest enterprises of the industry (TOP-10) in terms of annual revenue were selected according to the data from the Statistical Register for the latest available periods (2015 and 2014). Then the companies were ranged by assets turnover ratio (Table 1).

Assets turnover (times) is the ratio of sales revenue and company’s average total assets for a period. It characterizes the effectiveness of using of all available resources, regardless the source of their attraction. The ratio shows how many times per year the full cycle of production and circulation is performed, generating the corresponding effect in the form of profit.

The calculation of practical values of financial indicators, which might be considered as normal for a certain industry, has been developed and implemented in the Information and Analytical system Globas-i by the experts of Information Agency Credinform, taking into account the actual situation of the economy as a whole and the industries. The practical value of assets turnover ratio for manufacturers of dairy products is more than 1,82 times.

For the most full and fair opinion about company’s financial position not only the compliance with standard values, but the whole set of financial indicators and ratios should be taken into account.

Table 1. Net profit, revenue, assets turnover, solvency index Globas-i® of the largest Russian manufacturers of dairy products (TOP-10)
Name, INN, region2015 net profit, mln RUB2015 turnover, mln RUB2015/2014 revenue, +/- %2015 assets turnover, timesSolvency index Globas-i®
LLC UK PROSTO MOLOKO
INN 1660183627 Republic of Tatarstan
373,0 8 856,3 -12 5,59 253
High
JSC KORENOVSKY MILK PROCESSING FACTORY
INN 2335013799 Krasnodar region
729,0 11 481,3 26 3,13 183
The highest
LLC HOCHLAND RUSSLAND
INN 5040048921 Moscow region
1 156,8 13 304,1 15 2,70 153
The highest
PAO VORONEZH DAIRY MILL
INN 3662009586 Voronezh region
699,6 13 946,6 25 2,15 189
The highest
PAO MILKOM
INN 1834100340 Udmurt Republic
884,4 12 480,3 16 2,02 208
High
JSC WIMM-BILL-DANN
INN 7713085659 Moscow
6 380,3 89 541,9 6 1,95 163
The highest
LLC CAMPINA
INN 5045021970 Moscow region
-265,1 8 884,5 -7 1,79 296
High
UNIMILK LIMITED COMPANY
INN 7714285185 Moscow
1 314,6 15 699,3 -65 1,70 210
High
DANONE INDUSTRIA LLC
INN 5048005969 Moscow region
1 489,7 33 052,1 -10 1,57 243
High
NAO DANON RUSSIA
INN 7714626332 Moscow
-1 428,6 45 740,1 12 1,36 286
High
Total for TOP-10 group of companies
(* - average value within group of companies)
11 333,7 252 986,5 *-6 *2,40  
Total for TOP-100 group of companies
(* - average value within group of companies)
20 180,8 523 778,4 *6 *3,08  
Average value within industry 9,3 297,3 -7 1,82  

In 2015 the average value of the products’ profitability within TOP-10 group of companies is lower than average value within TOP-100 group of companies and higher than average industry value. Meanwhile four companies from TOP-10 list (yellow color in Table 1) have indicators that do not meet practical values.

Assets turnover and revenue of the largest Russian manufacturers of dairy products (TOP-10)
Picture 1. Assets turnover and revenue of the largest Russian manufacturers of dairy products (TOP-10)

Total revenue of 10 largest companies amounted to 48% from TOP-100 total revenue. This fact testifies rather high level of competition within industry. The shares of the largest companies by 2015 total revenue - JSC WIMM-BILL-DANN and NAO DANON RUSSIA in TOP-100 total revenue amounted to 26% (Picture 2).

The shares of TOP-10 companies in TOP-100 total revenue for 2015, %
Picture 2. The shares of TOP-10 companies in TOP-100 total revenue for 2015, %

All companies from TOP-10 list have the highest or high solvency index Globas-i®, this fact shows the ability of the companies to meet their obligations in time and fully.

In 2015 five companies from TOP-10 have decrease in revenue in comparison with previous period and have loss (red color in Table 1).

In 2014 the TOP-100 list included 11 loss-making companies and in 2015 the number decreased to 5, in other words by 2.2 times.

In general, within 2010-2016 the ratios of dairy products manufacturers in natural terms were unstable; this testifies the data from the Federal State Statistics Service (Table 2).

Table 2. Manufacture of main (more than 100 th units in 2016) types of dairy products in natural terms
 2010 г.2011 г.2012 г.2013 г.2014 г.2015 г.2016 г.2016 г. к 2010 г., %
Cheese products, tons 44 979 52 132 51 981 87 040 115 792 132 907 136 237 103
Medium-hard cheese, tons 70 552 92 586 110 552 94 861 96 372 113 026 124 582 77
Curd cheese products, tons 216 739 299 250 319 996 345 753 359 855 375 284 364 539 68
Cream, tons 78 463 80 760 95 139 102 972 115 550 121 111 125 461 60
Drinks ready for use and cocktails based on milk and cocoa, tons 75 739 95 088 130 733 141 366 148 866 116 535 114 199 51
Butter milk without food products and food additives, tons 683 115 783 371 846 660 943 328 950 144 953 697 964 827 41
Cheeses and cheese products, tons 433 376 425 359 445 467 428 613 494 319 581 315 599 687 38
Cheese and curd cheese, tons 1 041 844 1 110 245 1 170 354 1 153 876 1 242 956 1 375 310 1 376 129 32
Yogurt without food products and food additives, tons 100 580 102 650 126 896 124 028 125 018 127 042 125 517 25
Sweet creamy butter with mass fraction of fat from 50% to 79 %, tons 168 607 186 783 185 743 187 955 217 062 218 968 204 919 22
Hard pressed cheese, tons 112 526 100 684 105 523 85 716 106 233 144 166 137 203 22
Butter and oil pastes, tons 206 831 217 980 215 765 221 889 253 241 260 584 250 802 21
Butter, tons 205 152 216 274 213 579 219 843 250 783 258 930 247 413 21
Whole-milk products (in recalculation on milk) th tons 11 295 10 576 11 254 11 563 11 445 11 626 11 855 15
Liquid processed milk, tons 4 870 373 4 859 461 5 250 812 5 345 180 5 317 466 5 377 867 5 490 475 13
Sour cream with mass fraction of fat from 15,0% to 34.0 %, tons 487 445 496 524 544 421 525 157 513 883 540 059 537 567 12
Condensed milk products with food products and food additives, th standard cans 282 811 278 790 240 948 234 443 286 171 298 565 316 790 12
Yogurt, tons 699 820 703 469 732 221 772 308 776 911 765 539 778 847 11
Sour cream, tons 527 479 533 486 581 064 556 456 550 318 586 635 585 760 11
Dairy products, tons 2 258 347 2 290 179 2 397 347 2 505 333 2 484 109 2 439 741 2 479 895 10
Yogurt and other milk or cream fermented or acidified, tons 2 829 213 2 839 254 2 995 885 3 077 586 3 052 499 3 045 407 3 088 109 9
Milk and cream in solid forms, tons 109 679 132 527 123 806 116 183 147 708 127 298 117 819 7
Butter milk, tons 1 008 791 1 030 457 1 063 976 1 095 465 1 082 751 1 067 573 1 068 050 6
Ryazhenka, tons 208 081 212 947 224 114 223 768 216 156 217 207 221 291 6
Fermented milk products, fermented heat-treated products, tons 172 552 168 556 186 142 199 981 164 219 163 383 182 967 6
Ice cream and other frozen desserts, tons 387 416 334 712 364 154 369 458 377 739 375 429 407 114 5
Curd cheese, tons 387 372 381 037 397 310 372 177 382 571 413 341 405 148 5
Condensed milk products, th standard cans 880 014 853 492 861 000 859 885 830 091 828 570 847 009 -4
Condensed milk, th standard cans 589 648 570 727 617 145 621 104 540 140 525 944 526 954 -11
Cream cheese, tons 146 813 123 190 115 075 94 533 99 607 102 876 106 171 -28

*) Red color in table 2 shows decline in production, green color shows the growth.

Within 2010-2016 production of cheese and curd cheese products, as well as cream grew was ramping up at the fastest rates. Production of condensed milk and cream cheese within this period decreased.

Manufacturers of dairy products are relatively equally distributed across the country with a slight predominance in the densely populated Moscow region. This fact is confirmed by data from the Information and Analytical system Globas-i, according to which 100 largest companies of the industry in terms of 2015 revenue are registered in 43 Russian regions (Picture 4).

Distribution across the country of 100 largest Russian manufacturers of dairy products
Picture 4. Distribution across the country of 100 largest Russian manufacturers of dairy products