
Order a report
Custom-made industry research, company ratings, competitor analysis


Trends in activity of the largest companies of the real economy sector of Leningrad region
Information Agency Credinform has prepared the review of trends in activity of the largest companies of the real economy sector of Leningrad region.
The largest enterprises (TOP-10 and TOP-1000) in terms of annual revenue were selected according to the data from the Statistical Register for the latest available periods (2014 – 2016). The analysis was based on data of the Information and Analytical system Globas.
Net assets
Indicator of real cost of corporate assets, which is annually calculated as the difference between assets of the company and its debt liabilities. If the company’s debts exceed net worth value, net assets indicator is considered negative (insufficiency of property).
| Position in ТОP-1000 | Name, activity | Net asset value, bln RUB* | Solvency index Globas | ||
| 2014 | 2015 | 2016 | |||
| 1 | 2 | 3 | 4 | 5 | 6 |
| 1. | LLC KINEF Manufacture of refined petroleum products |
18,4 | 7,5 | 41,0 | 253 Medium |
| 2. | TRANSNEFT-PORT PRIMORSK, LTD Other cargo handling |
19,9 | 23,6 | 26,1 | 184 High |
| 3. | NAO PHILIP MORRIS IZHORA Manufacture of tobacco products |
19,4 | 23,0 | 25,8 | 173 Superior |
| 4. | NOKIAN SHINA LTD Sale of motor vehicle parts and accessories |
13,7 | 21,7 | 23,3 | 148 Superior |
| 5. | LLC NOVATEK-UST'-LUGA Manufacture of refined petroleum products |
20,3 | 33,7 | 23,2 | 193 High |
| 996. | LLC STROILES-2 Logging In process of reorganization in the form of accession |
-1,5 | -1,8 | -1,4 | 600 Insufficient |
| 997. | PAO LENINGRAD SHIPYARD PELLA Building of ships and floating structures |
0,4 | -0,9 | -1,5 | 275 Medium |
| 998. | YURA CORPORATION RUS LLC Manufacture of other electrical equipment |
-1,1 | -2,3 | -2,0 | 290 Medium |
| 999. | LLC MLP-KAD Renting and operating of own or leased untenanted real estate |
-4,6 | -6,5 | -5,1 | 264 Medium |
| 1000. | LLC EUROPEAN SULFUR TERMINAL Other cargo handling |
-8,9 | -10,8 | -7,2 | 257 Medium |
*) – growth/decline indicators in comparison with prior period are marked green and red in columns 4 and 5 respectively.
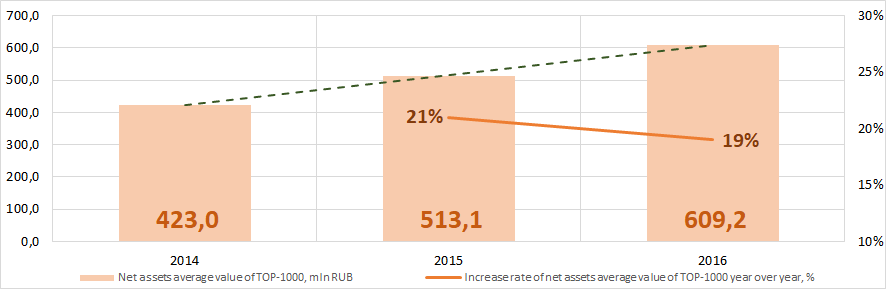 Picture 1. Change in average net assets value of the largest companies of the real economy sector of Leningrad region in 2014 – 2016
Sales revenue
In 2016 total revenue of 10 largest companies amounted to 33% from TOP-1000 total revenue (Picture 2).
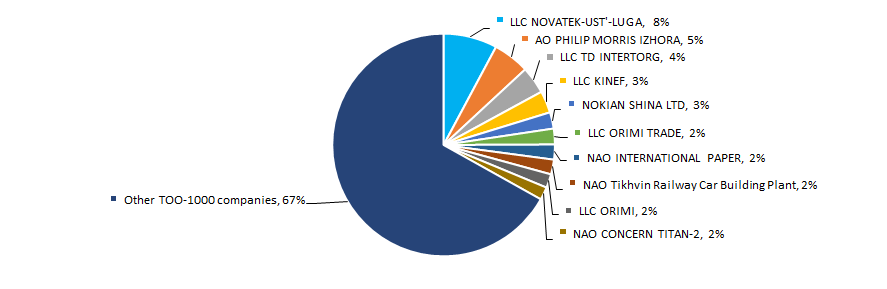 Picture 2. Shares of TOP-10 companies in TOP-1000 total revenue for 2016
The increase in sales revenue is observed (Picture 3).
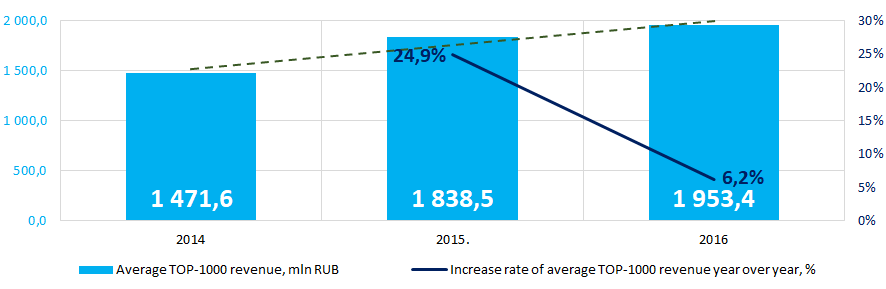 Picture 3. Change in average revenue of the largest companies of the real economy sector of Leningrad region in 2014 – 2016
Profit and loss
In 2016, profit of 10 largest companies amounted to 56% from TOP-1000 total profit (Picture 4).
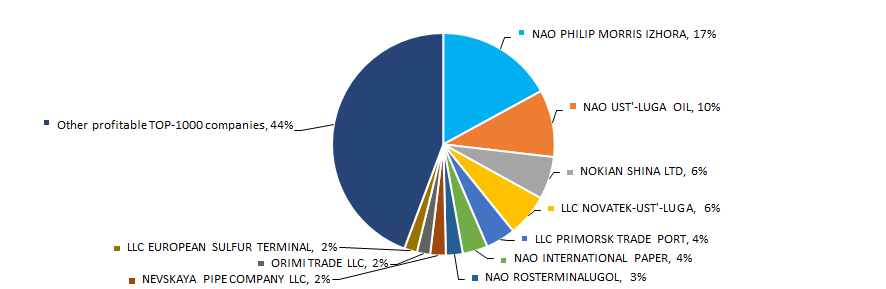 Picture 4. Shares of TOP-10 companies in TOP-1000 total profit for 2016
For the three-year period, the average revenue values of TOP-1000 companies show the growing tendency and the average net loss decreases (Picture 5).
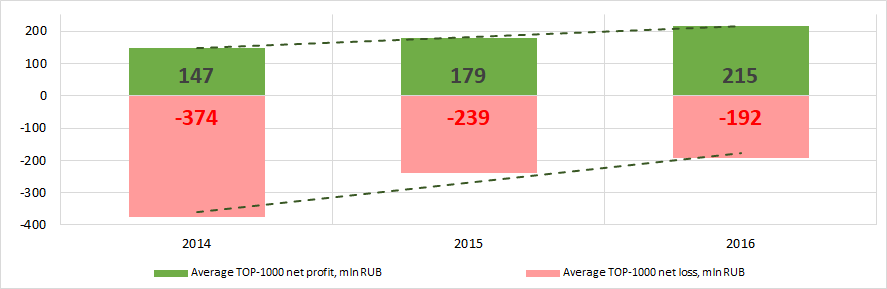 Picture 5. Change in average profit/loss of the largest companies of the real economy sector of Leningrad region in 2014 – 2016
Main financial ratios
For 2014 – 2016 period the average values of current liquidity ratio of TOP-1000 were higher than recommended values – from 1,0 to 2,0 (Picture 6).
Current liquidity ratio (ratio of total working capital to short-term liabilities) shows the sufficiency of company’s assets to meet short-term obligations.
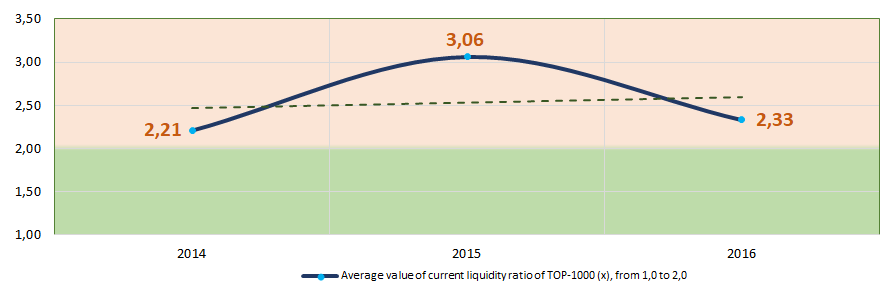 Picture 6. Change in average values of current liquidity ratio of the largest companies of the real economy sector of Leningrad region in 2014 – 2016
For the three-year period, the instability of ROI ratio with increasing tendency is observed (Picture 7). The ROI ratio is calculated as a ratio of net profit to sum of stockholder equity and long-term liabilities and shows the return from equity involved in commercial activities and long-term borrowed funds.
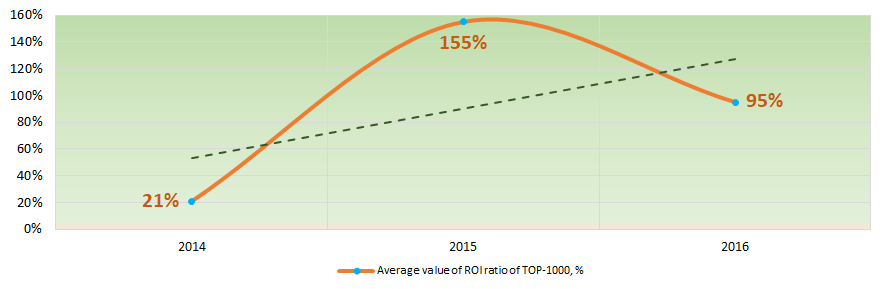 Picture 7. Change in average values of ROI ratio of the largest companies of the real economy sector of Leningrad region in 2014 – 2016
Assets turnover ratio is the ratio of sales revenue and company’s average total assets for a period. It characterizes the effectiveness of using of all available resources, regardless the source of their attraction. The ratio shows how many times per year the full cycle of production and circulation is performed, generating the corresponding effect in the form of profit.
For the three-year period, this business activity ratio demonstrated the upward trend (Picture 8).
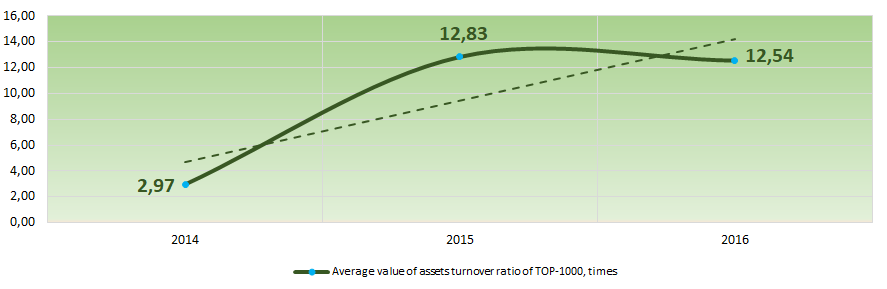 Picture 8. Change in average values of assets turnover ratio of the largest companies of the real economy sector of Leningrad region in 2014 – 2016
Production and services structure
The largest share in TOP-1000 total revenue take companies engaged in wholesale trade and production of petroleum products (Picture 9).
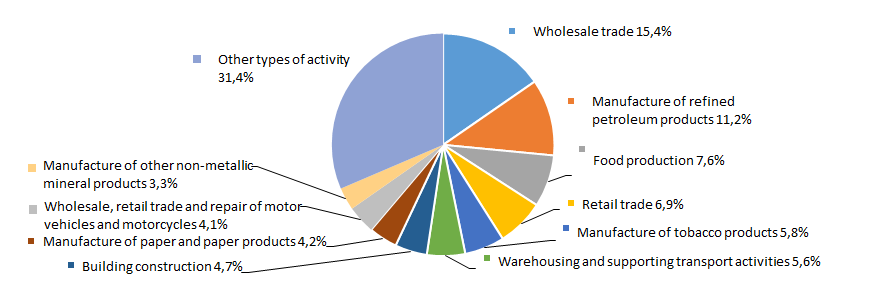 Picture 9. Distribution of activities in TOP-1000 total revenue, %
Financial position score
The assessment of TOP-1000 financial position shows that more than a half of companies have stable or above average financial position (Picture 10).
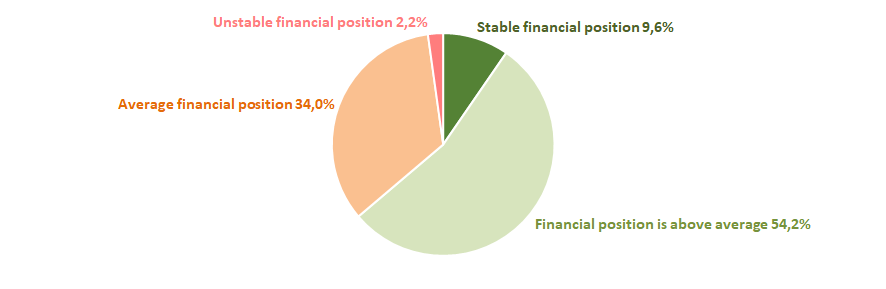 Pictiure 10. Distribution of TOP-1000 companies by financial position score
Solvency index Globas
The majority of TOP-1000 companies have superior/high or strong/medium solvency index Globas, this fact shows the ability of the companies to meet their obligations in time and fully (Picture 11).
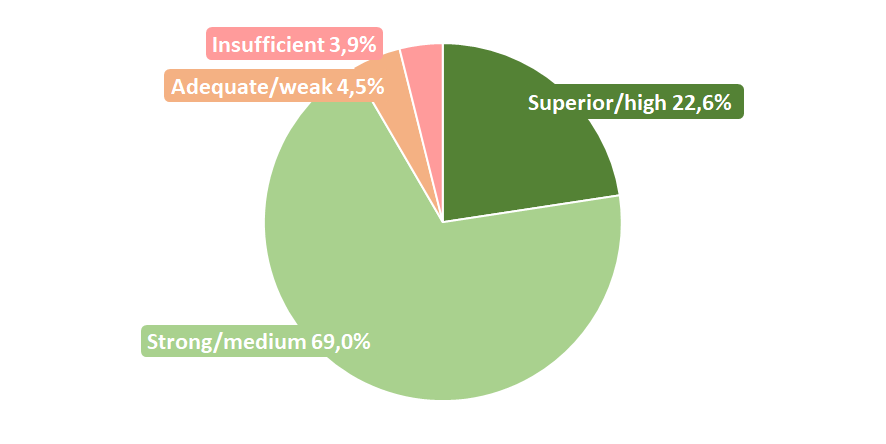 Picture 11. Distribution of TOP-1000 companies by solvency index Globas
Hereby, the complex assessment of the largest real economy companies of Leningrad region, taking into account main indexes, financial ratios and indicators, demonstrates the denomination of favorable trends.