
Order a report
Custom-made industry research, company ratings, competitor analysis


Debt/equity ratio of companies engaged in software development and consulting in this field
Information agency Credinform prepared a ranking «Debt/equity ratio of companies engaged in software development and consulting in this field». The companies with highest volume of revenue were selected for this ranking according to data from the Statistical Register for the latest available period (for the year 2012). Then, the first 10 enterprises selected by turnover were ranked by increase in debt/equity ratio.
Mentioned indicator – debt/equity ratio – belongs to the group of financial stability indexes. Indicators of this group are interesting first of all for long-term credits, because they characterize the firm's ability to satisfy its long-term obligations. So that, the debt/equity ratio is calculated as the relation of total borrowed funds to amount of internal capital and shows how many units of borrowed funds were added by an enterprise to each unit of its own funding sources.
Recommended value of the considered indicator is less than 1. At the same time, the debt/equity ratio cannot be negative, that’s why its value within the interval from 0 to 1 is one of indicators of high ability of a company to repay its liabilities.
| № | Name, INN | Region | Turnover for 2012 in mln RUB | Debt/equity ratio, (х) | Solvency index GLOBAS-i® |
|---|---|---|---|---|---|
| 1 | SAP SNG LLC INN 7705058323 |
Moscow | 16 315 | 1,23 | 230 (high) |
| 2 | Inform LLC INN 7725624249 |
Moscow | 10 062 | 1,84 | 232 (high) |
| 3 | EDVANSED TRANSFORMEISHN KONSALTING LLC INN 7715744096 |
Moscow | 5886 | 2,17 | 212 (high) |
| 4 | Maikrosoft Rus LLC INN 7743528989 |
Moscow | 8915 | 3,21 | 227 (high) |
| 5 | KROK INKORPOREITED CJSC INN 7701004101 |
Moscow | 29 187 | 3,76 | 207 (high) |
| 6 | OTKRYTYE TEHNOLOGII 98 CJSC INN 7729376075 |
Moscow | 6252 | 5,2 | 197 (the highest) |
| 7 | OTRASLEVOI TSENTR VNEDRENIYA NOVOI TEHNIKI I TEHNOLOGY CJSC INN 7717130165 |
Moscow | 10 318 | 8,09 | 180 (the highest) |
| 8 | ABSoft LLC INN 7610085752 |
Yaroslavl region | 57 975 | 22,97 | 276 (high) |
| 9 | MONT LLC INN 7703313144 |
Moscow | 11 376 | 55,44 | 200 (high) |
| 10 | GAZPROM INFORM LLC INN 7727696104 |
Moscow | 8312 | 96,99 | 270 (high) |
Analysis of results of 10 the largest software engineers showed that none of companies doesn’t meet recommended standards on the debt/equity ratio, because the indicator value is above 1, what testifies that companies misappropriate borrowed funds. Although all companies got a high and the highest solvency index GLOBAS-i®, that characterizes them as financially stable.
Debt/equity ratio of the largest on turnover companies engaged in software development and consulting in this field, TOP-10
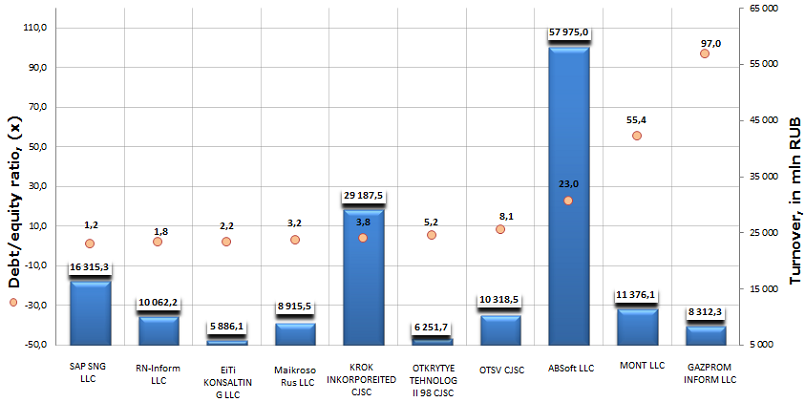
The best result was presented by the company SAP SNG LLC, having the lowest deviation from recommended values. Moreover, the enterprise is the 3rd in the branch on the turnover. In support of good results the company got a high solvency index GLOBAS-i®.
The enterprise with the highest turnover in the branch at year-end 2012 – KROK INKORPOREITED CJSC – is only on the 5th place in the ranking list, with the value of the debt/equity ratio being three times over the upper limit of the standard. Such result testifies to significant exceedence of credit resources over own capital of organization. However, the company got a high solvency index GLOBAS-i®.
In summary, it should be noted, that for the objective assessment of a company it should be considered not only recommended values of those or other indicators, but also of industry-average indicators. So that, the activity in the sphere of information technologies (IT) is science-intensive and requires significant material costs, this particular explains such high values of the debt/equity ratio by the analyzed enterprises.