
Order a report
Custom-made industry research, company ratings, competitor analysis


Trends in water transport industry
Information agency Credinform has observed trends in the activity of the largest Russian water transport companies.
Sea and river transport companies with the largest volume of annual revenue (TOP-10 and TOP-1000), were selected for the analysis, according to the data from the Statistical Register for the latest available periods (for 2015-2017). The analysis was made on the basis of the data of the Information and Analytical system Globas.
Net assets is an indicator, reflecting the real value of company's property, is calculated annually as the difference between assets on the enterprise balance and its debt obligations. The indicator of net assets is considered negative (insufficiency of property), if company’s debt exceeds the value of its property.
| № | Name, INN, region, type of activity | Net assets value, bln RUB | Solvency index Globas | ||
| 2015 | 2016 | 2017 | |||
| 1 | 2 | 3 | 4 | 5 | 6 |
| 1 | FAR-EASTERN SHIPPING COMPANY PLC INN 2540047110 Moscow Sea cargo transport activities |
30,71 | |
|
309 Adequate |
| 2 | LLC OBORONLOGISTICS INN 7718857267 Moscow Sea cargo transport activities |
1,19 | |
|
249 Strong |
| 3 | JSC VOLGA-SHIPPING INN 5260902190 Nizhniy Novgorod region Activities of inland water cargo transport |
5,96 | |
|
153 Superior |
| 4 | JSC NORTH-WESTERN SHIPPING COMPANY INN 7812023195 Saint-Petersburg Sea cargo transport activities |
4,84 | |
|
164 Superior |
| 5 | LLC NUTEP INN 2315024369 Krasnodar territory Sea cargo transport activities |
1,43 | |
|
173 Superior |
| 996 | LLC NAKHODKA-PORTBUNKER INN 2508060331 Maritime territory Sea cargo transport activities Bankruptcy proceedings |
-0,13 | |
|
550 Insufficient |
| 997 | LLC AQUAMARIN INN 7702655931 Moscow Activities of inland water passenger transport |
-1,78 | |
|
348 Adequate |
| 998 | LLC PALMALI INN 6164087026 Rostov region Sea cargo transport activities In the process of liquidation since 21.11.2018 |
-3,04 | |
|
600 Insufficient |
| 999 | LLC Magadan-Tranzit DV INN 4909910131 Magadan region Activities of sea passenger transport Bankruptcy proceedingsм |
0,02 | |
|
600 Insufficient |
| 1000 | JSC 'VOLZHSKI OIL SHIPPING COMPANY ''VOLGOTANKER'' INN 6317019185 Samara region Sea cargo transport activities In the process of liquidation since 17.03.2008 |
4,29 | |
|
600 Insufficient |
![]() — growth of the indicator to the previous period,
— growth of the indicator to the previous period, ![]() — decline of the indicator to the previous period .
— decline of the indicator to the previous period .
For ten years average amounts of net assets of TOP-1000 companies have decreasing tendency (Picture 1).
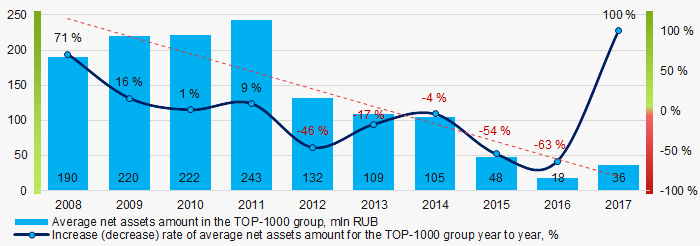 Picture 1. Change in TOP-1000 average indicators of the net assets amount of water transport companies in 2008 – 2017
 Share of companies with insufficiency of property among TOP-1000 for the last three years tends to increase (Picture 2).
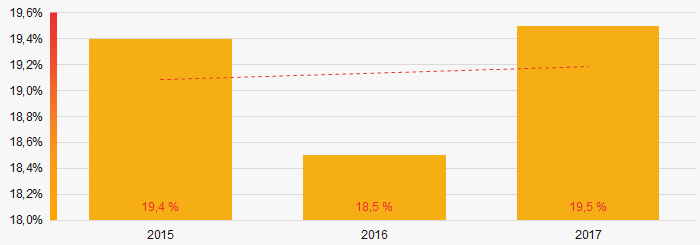 Picture 2. Share of companies with negative value of net assets amount in TOP-1000 in 2015 – 2017
 Sales revenue
The revenue of 10 leaders of the industry made 23% of the total revenue of TOP-1000 companies in 2017. It demonstrates high level of competition in the industry (Picture 3).
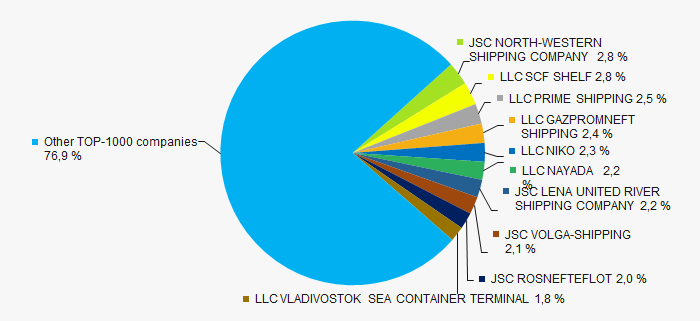 Picture 3. Shares of participation of TOP-10 companies in the total revenue of TOP-1000 companies for 2017
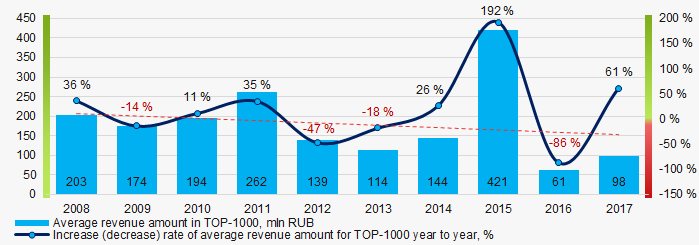 Picture 4. Change in the average revenue of TOP-1000 water transport companies in 2008 – 2017
Profit and losses
The profit volume of 10 leading enterprises in 2017 made 40% of the total profit of TOP-1000 companies (Picture 5).
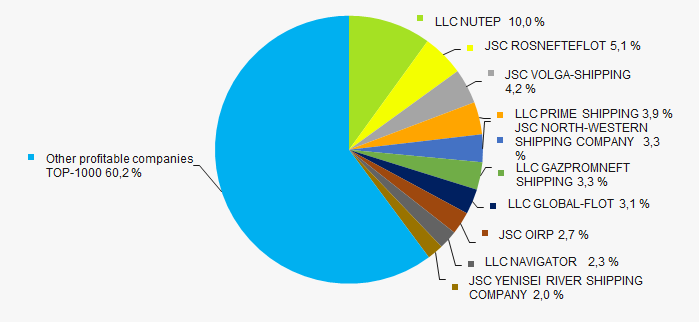 Picture 5. Share of participation of TOP-10 companies in the total volume of profit of TOP-1000 companies for 2017
Over a ten-year period, the average values of profit indicators of TOP-1000 companies tend to decrease (Picture 6).
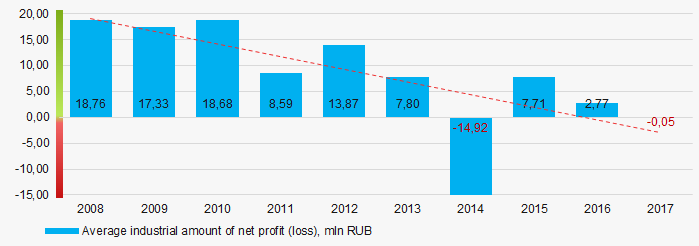 Picture 6. Change in the average indicators of net profit of TOP-1000 water transport companies in 2008 – 2017
 Over the three-year period average values of net profit indicators of TOP-1000 companies have increasing tendency, besides, average amount of net loss is increasing. (Picture 6).
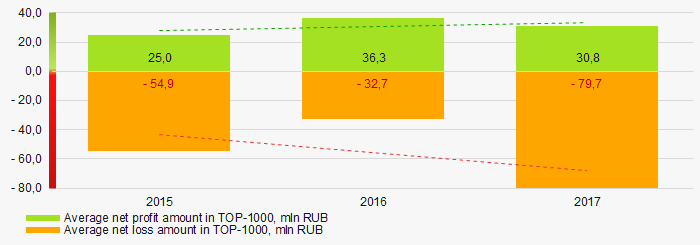 Picture 7. Change in the average indicators of profit and loss of TOP-1000 companies in 2015 – 2017
 Key financial ratios
Over the ten-year period the average indicators of the current liquidity ratio were above the range of recommended values – from 1,0 up to 2,0 with decreasing tendency (Picture 8).
The current liquidity ratio (the relation of the amount of current assets to short-term liabilities) shows the sufficiency of company’s funds for repayment of its short-term liabilities.
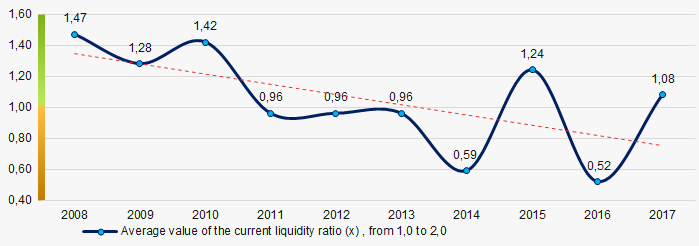 Picture 8. Change in the industry values of the current liquidity ratio of TOP-1000 companies in 2008 – 2017
 The indicators of the return on investments ratio were at the relatively low level with decreasing tendency for ten years. (Picture 9).
The ratio is calculated as the relation of net profit to the sum of own capital and long-term liabilities and demonstrates the return on the equity involved in the commercial activity of own capital and the long-term borrowed funds of an organization.
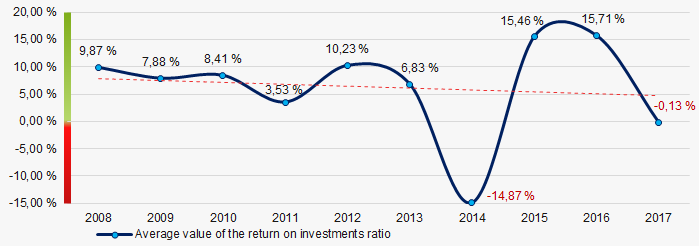 Picture 9. Change in the average values of the return on investments ratio of TOP-1000 water transport companies in 2008 – 2017
Asset turnover ratio is calculated as the relation of sales revenue to the average value of total assets for a period and characterizes the efficiency of use of all available resources, regardless of the sources of their attraction. The ratio shows how many times a year a complete cycle of production and circulation is made, yielding profit.
This business activity ratio showed a tendency to increase for ten-year period (Picture 10).
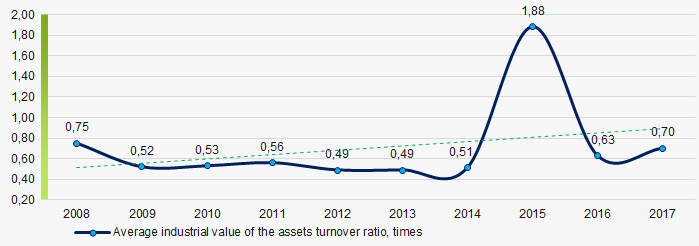 Picture 10. Change in the average values of the asset turnover ratio of TOP-1000 companies in 2008 – 2017
 Service structure
The largest share in the total revenue of TOP-1000 is owned by companies, specializing in sea cargo transportations (Picture 11).
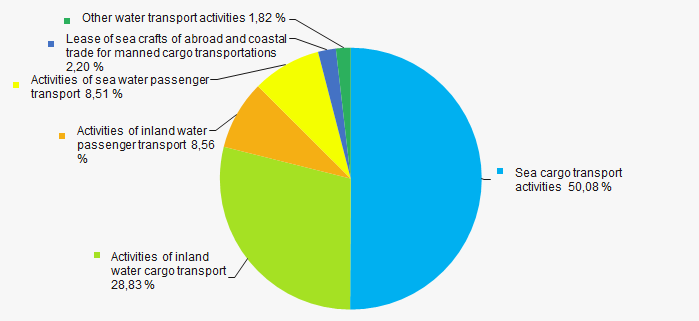 Picture 11. Distribution of companies by types of output in the total revenue of TOP-1000
83% of TOP-1000 companies are registered in the Register of small and medium enterprises of the Federal Tax Service of the RF. Besides, share of the companies in the total revenue of TOP-1000 amounts to 36% in 2017 (Picture 12).p>
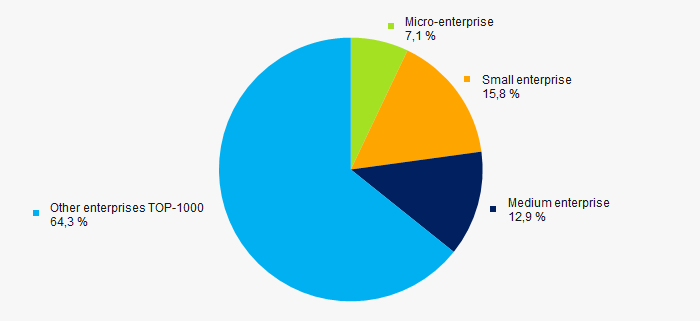 Picture 12. Shares of small and medium enterprises in TOP-1000 companies, %
Main regions of activities
TOP-1000 companies are quite equally distributed on the territory of Russia, taking into account type of activity and geographic position and registered in 62 regions. The largest companies in terms of revenue volume are concentrated in Saint-Petersburg and Maritime territory (Picture 13).
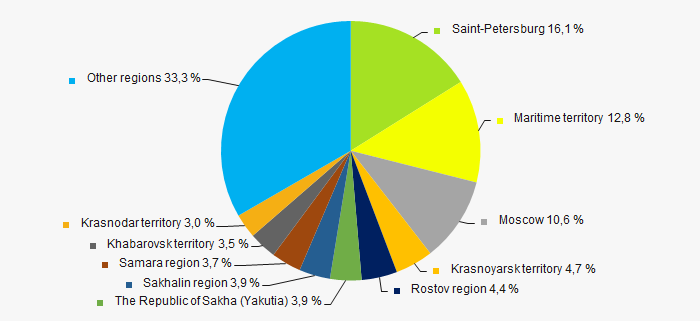 Picture 13. Distribution of revenue of TOP-1000 companies by regions of Russia
 Financial position score
An assessment of the financial position of TOP-1000 companies shows that major part of companies is in an average financial position (Picture 14).
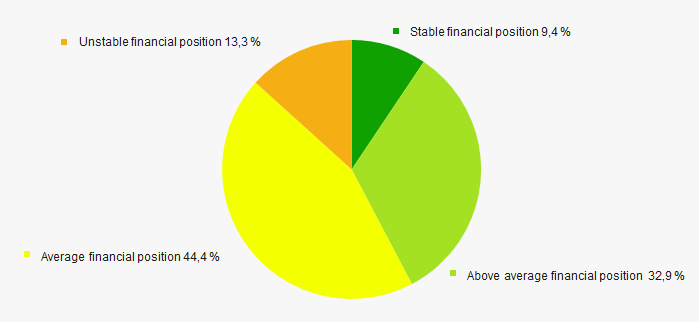 Picture 14. Distribution of TOP-1000 companies by financial position score
Solvency index Globas
Most of TOP-1000 companies have got from Adequate to Superior Solvency index Globas, that points to their ability to repay their debts in time and fully (Picture 15).
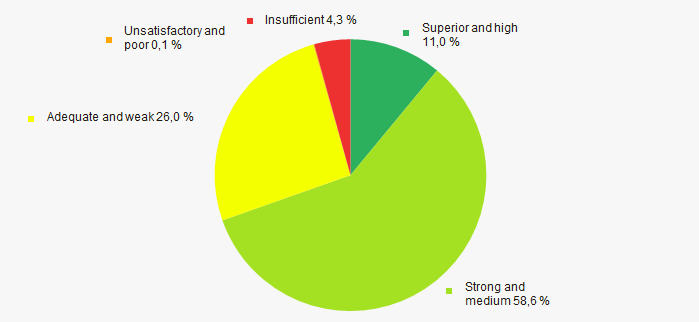 Picture 15. Distribution of TOP-1000 companies by solvency index Globas
Conclusion
Comprehensive assessment of the activity of largest water transport companies, taking into account the main indexes, financial indicators and ratios, demonstrates the presence of some unfavorable trends (Table 2).
| Trends and assessment factors | Share of factor, % |
| Rate of increase (decrease) of average amount of net assets | |
| Increase / decrease of share of companies with negative values of net assets | |
| Increase (decrease) rate of average revenue amount | |
| Rate of competition / monopolization | |
| Increase (decrease) rate of average net profit (loss) amount | |
| Increase / decrease of average net profit amount of TOP-1000 companies | |
| Increase / decrease of average net loss amount of TOP-1000 companies | |
| Increase / decrease of average industrial values of the current liquidity ratio | |
| Increase / decrease of average industrial values of the return on investments ratio | |
| Increase / decrease of average industrial values of the assets turnover ratio | |
| Share of small and medium enterprises in the industry in terms of revenue volume more than 30% | |
| Regional concentration | |
| Financial position (major share) | |
| Solvency index Globas (major share) | |
| Average value of factors | |
![]() — positive trend (factor) ,
— positive trend (factor) , ![]() — negative trend (factor).
— negative trend (factor).