
Order a report
Custom-made industry research, company ratings, competitor analysis


Trends in activity of hotels
Information agency Credinform has prepared a review of trends in activity of the largest Russian hotels.
The largest companies (ТОP-10 and ТОP-1000) in terms of annual revenue were selected according to the data from the Statistical Register for the latest available periods (2015 - 2017). The analysis was based on data of the Information and Analytical system Globas.
Net assets is a ratio reflecting the real value of company's property. It is calculated annually as the difference between assets on the enterprise balance and its debt obligations. The ratio is considered negative (insufficiency of property), if company’s debt exceeds the value of its property.
| Position in ТОP-1000 Name, INN, region | Net assets value, billion RUB | Solvency index Globas | ||
| 2015 | 2016 | 2017 | ||
| 1 | 2 | 3 | 4 | 5 |
| 1 LLC EKOLOGO-TURISTICHESKII TSENTR V PARKOVOM INN 9103016009 Republic Of Crimea |
5,99 | |
|
191 High |
| 2 LLC PROMETEY-CITY INN 7702648726 Moscow |
3,77 | |
|
210 Strong |
| 3 PAO HOTEL COSMOS INN 7717016198 Moscow |
2,88 | |
|
141 Superior |
| 4 VISIT- MOSCOW, LTD INN 7703026485 Moscow |
4,28 | |
|
251 Medium |
| 5 NAO LOTTE RUS INN 7704169180 Moscow |
0,63 | |
|
238 Strong |
| 996 LLC HOTEL DEVELOPMENT COMPANY INN 6658383040 Sverdlovsk region |
-4,16 | |
|
320 Adequate |
| 997 NAO Krasnaya polyana INN 2320102816 Krasnodar region |
1,31 | |
|
275 Medium |
| 998 LLC InvestGroup-Hotel INN 7724654956 Krasnodar region Сase on declaring the company bankrupt (insolvent) is proceeding |
-5,64 | |
|
550 Insufficient |
| 999 LLC YUG-NOVYI VEK INN 2320092269 Krasnodar region |
-12,28 | |
|
320 Adequate |
| 1000 SKI RESORT DEVELOPMENT COMPANY ROSA KHUTOR LLC INN 7702347870 Moscow |
-31,01 | |
|
267 Medium |
![]() — growth of the indicator to the previous period,
— growth of the indicator to the previous period, ![]() — decline of the indicator to the previous period.
— decline of the indicator to the previous period.
For the last five years, the average values of TOP-1000 net assets showed the downward trend (Picture 1).
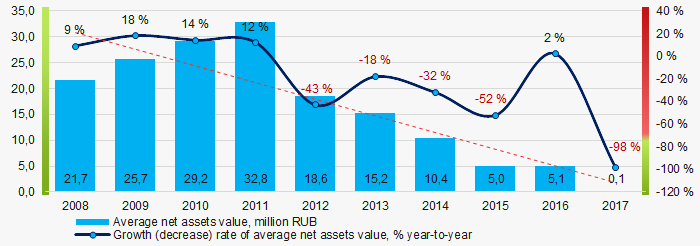 Picture 1. Change in average net assets value of Russian hotels in 2013 – 2017
For the last three years, the share of ТОP-1000 enterprises with lack of property are relatively at a high level and showed the downward trend (Picture 2).
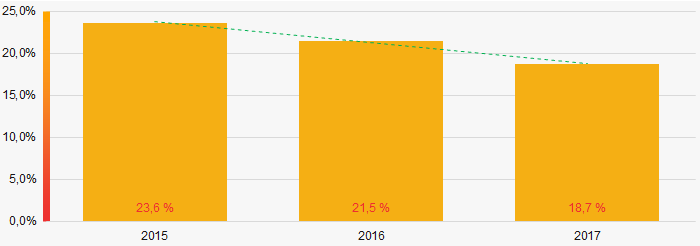 Picture 2. The share of enterprises with negative net assets value in ТОP-1000 in 2015-2017
Sales revenue
In 2017, the total revenue of 10 largest companies amounted to 16% from ТОP-1000 total revenue (Picture 3). This fact testifies high level of competition within industry.
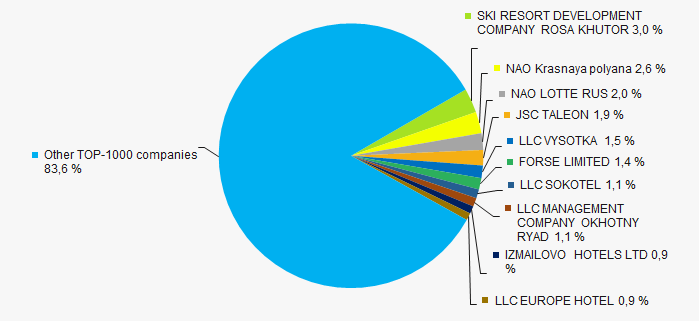 Picture 3. Shares of TOP-10 in TOP-1000 total revenue for 2017
In general, for the last ten years, the downward trend in average revenue is observed (Picture 4).
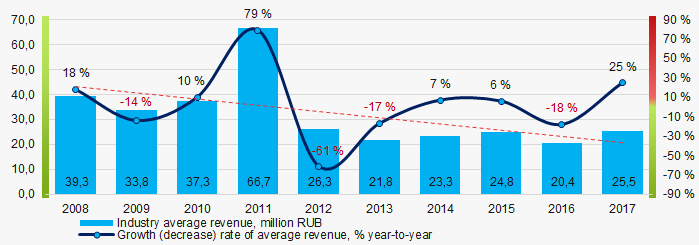 Picture 4. Change in average revenue of Russian hotels in 2008 – 2017
Profit and loss
In 2017 profit of 10 largest companies amounted to 27% from TOP-1000 total profit (Picture 5).
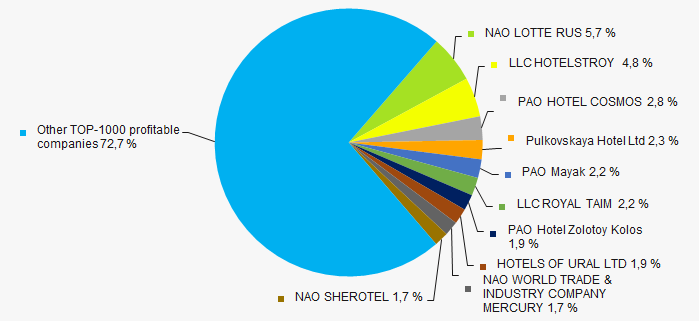 Picture 5. Shares of TOP-10 companies in TOP-1000 total profit for 2017
For the last ten years, the average profit values show the downward trend (Picture 6).
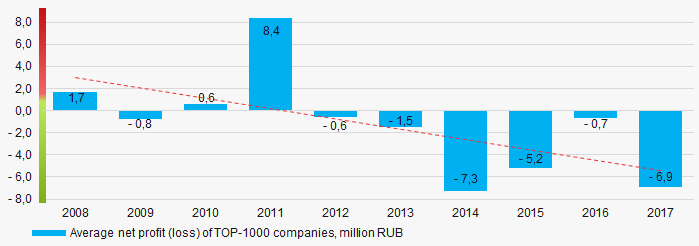 Picture 6. Change in average profit of TOP-1000 in 2008 – 2017
Over a three-year period, the average net profit values of ТОP-1000 show the increasing tendency, along with this the average net loss is decreasing (Picture 7).
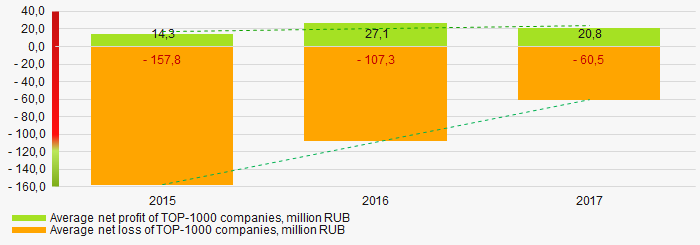 Picture 7. Change in average net profit/loss of ТОP-1000 companies in 2015 – 2017
Main financial ratios
For the last ten years, since 2014 the average values of the current liquidity ratio were lower than the recommended values - from 1,0 to 2,0, with downward trend (Picture 8).
The current liquidity ratio (ratio of total working capital to short-term liabilities) shows the sufficiency of company’s assets to meet short-term obligations
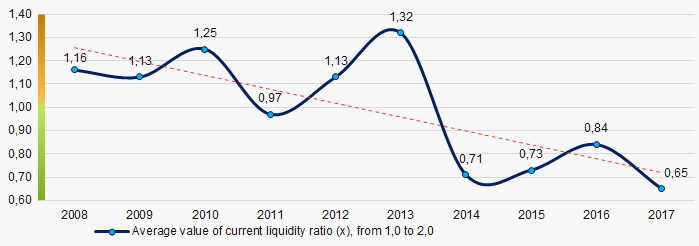 Picture 8. Change in average values of current liquidity ratio of Russian hotels in 2008 – 2017
For the last ten years, the average values of ROI ratio with downward trend were observed (Picture 9).
The ROI ratio is calculated as a ratio of net profit to sum of stockholder equity and long-term liabilities and shows the return from equity involved in commercial activities and long-term borrowed funds.
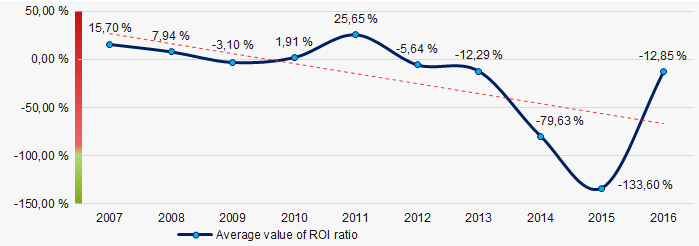 Picture 9. Change in average values of ROI ratio in 2007 – 2016
Assets turnover ratio is the ratio of sales revenue and company’s average total assets for a period. It characterizes the effectiveness of using of all available resources, regardless the source of their attraction. The ratio shows how many times per year the full cycle of production and circulation is performed, generating the corresponding effect in the form of profit.
For the last ten years, this business activity ratio demonstrated the downward trend (Picture 10).
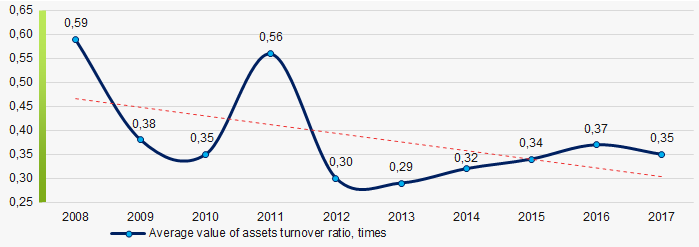 Picture 10. Change in average values of assets turnover ratio of TOP-1000 companies in 2008 – 2017
Production structure
The largest share of ТОP-1000 total revenue is occupied by the enterprises engaged in activities of hotels and other places of temporary accommodation (Picture 11).
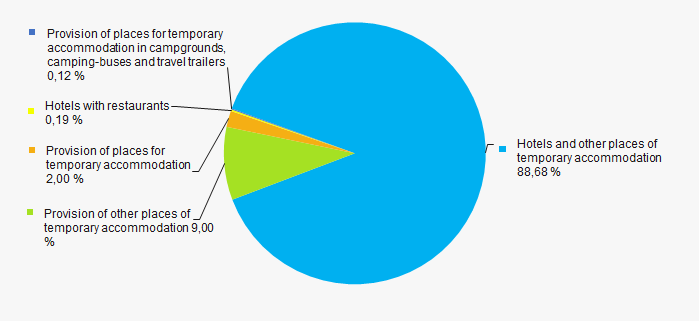 Picture 11. Distribution of activities in ТОP-1000 total revenue
73% of ТОP-1000 companies are registered in the Unified register of small and medium-sized enterprises of the Russian Federal Tax Service. Herein, in 2017 their share in TOP-1000 total revenue amounted to 35%, which is significantly higher than the average index for the country (Picture 12).
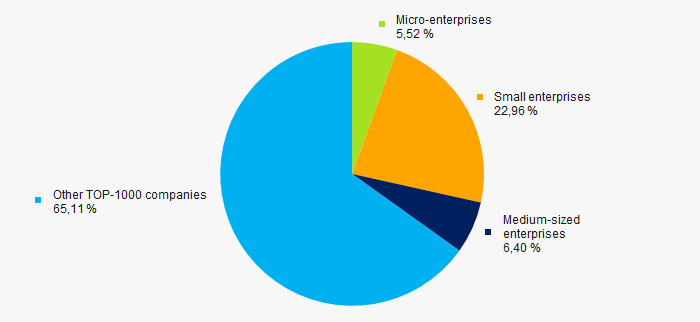 Picture 12. Shares of small and medium-sized enterprises in ТОP-1000, %
Main regions of activity
ТОP-1000 companies are unequally located across the country and registered in 77 regions of Russia. The largest enterprises in terms of revenue are located in Moscow and St. Petersburg (Picture 13).
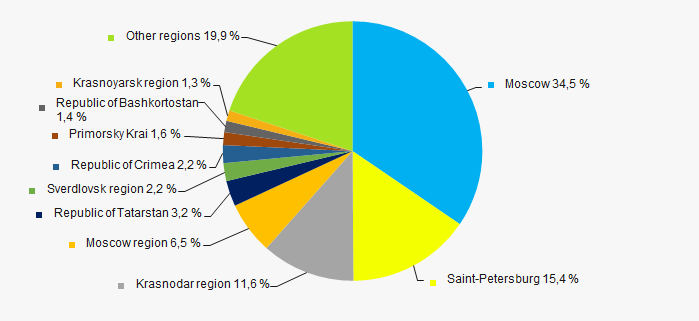 Picture 13. Distribution of TOP-1000 revenue by Russian regions
Financial position score
An assessment of the financial position of TOP-1000 companies shows that more than a half of them have average financial position (Picture 14).
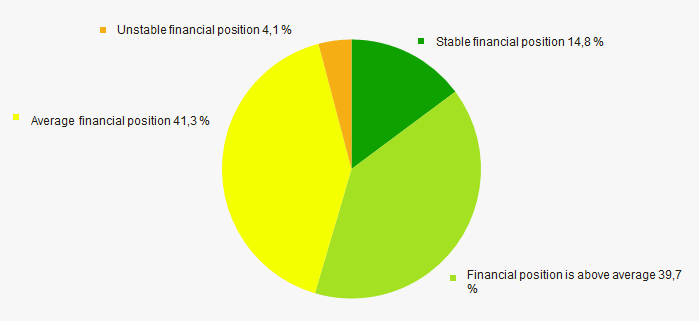 Picture 14. Distribution of TOP-1000 companies by financial position score
Solvency index Globas
Most of TOP-1000 companies got superior/high or strong/medium Solvency index Globas, this fact shows the ability of the companies to meet their obligations in time and fully (Picture 15).
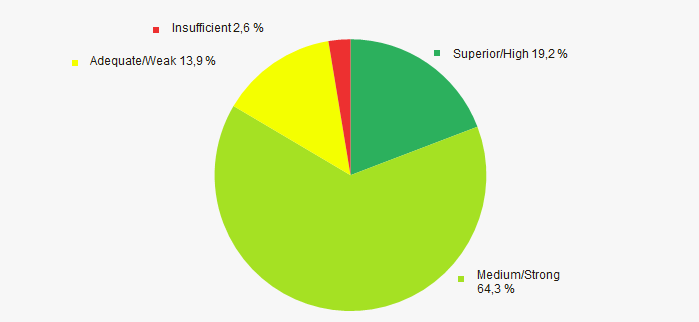 Picture 15. Distribution of TOP-1000 companies by Solvency index Globas
Conclusion
A complex assessment of activity of the largest Russian hotels, taking into account the main indexes, financial ratios and indicators, demonstrates the presence of negative trends (Table 2).
| Trends and assessment factors | Relative share, % |
| Growth/drawdown rate of average net assets value | |
| Increase / decrease in the share of enterprises with negative net assets | |
| Growth/drawdown rate of average revenue | |
| Competition/ monopolization level | |
| Growth/drawdown rate of average net profit (loss) | |
| Increase / decrease in average net profit of companies | |
| Increase / decrease in average net loss of companies | |
| Increase / decrease in average values of current liquidity ratio | |
| Increase / decrease in average values of ROI ratio | |
| Increase / decrease in average values of assets turnover ratio | |
| Share of small and medium-sized businesses by revenue more than 22% | |
| Regional concentration | |
| Financial position (the largest share) | |
| Solvency index Globas (the largest share) | |
| Average value of factors | |
![]() — favorable trend (factor),
— favorable trend (factor), ![]() — unfavorable trend (factor).
— unfavorable trend (factor).