
Order a report
Custom-made industry research, company ratings, competitor analysis


Trends in bus transportation
Information Agency Credinform presents a review of activity trends of the largest bus transportation companies. Passenger transportation companies with the largest annual revenue (TOP-10 and TOP-1000) have been selected for the analysis, according to the data from the Statistical Register for the latest available accounting periods (2015 — 2017). The analysis was based on the data from the Information and Analytical system Globas .
Net assets indicate fair value of corporate assets that is calculated annually as assets on balance less company’s liabilities. Net assets value is negative (insufficiency of property) if liabilities are larger than the property value.
| № | Name, INN, region | Net assets value, million RUB | Solvency index Globas | ||
| 2015 | 2016 | 2017 | |||
| 1 | 2 | 3 | 4 | 5 | 6 |
| 1 | State unitary enterprise of Moscow region MOSTRANSAVTO INN 5000000017 Moscow region |
20913,2 | |
|
258 Medium |
| 2 | State unitary enterprise of Saint Petersburg PASSAZHIRAVTOTRANS INN 7830001758 Saint Petersburg |
5684,9 | |
|
202 Strong |
| 3 | Municipal transportation company ROSTOVPASSAZHIRTRANS INN 6163050739 Rostov region |
503,6 | |
|
276 Medium |
| 4 | Municipal unitary enterprise Transportation Company of Municipal district of Yuzhno-Sakhalinsk INN 6501238799 Sakhalin region |
117,7 | |
|
299 Medium |
| 5 | JSC Third Park INN 7814010096 Saint Petersburg |
527,8 | |
|
210 Strong |
| 996 | Municipal enterprise SAMARA PASSAZHIRAVTOTRANS INN 6318163505 Samara region |
405,9 | |
|
322 Adequate |
| 997 | Municipal enterprise Khabarovsk Passenger Road transportation enterprise No. 1 INN 2724018687 Khabarovsk territory Process of being wound up, since 18.08.2016 |
7,2 | |
|
600 Insufficient |
| 998 | Municipal enterprise Passenger Transportation of Penza INN 5834030883 Penza region Process of being wound up, since 31.10.2014 |
-447,9 | |
|
600 Insufficient |
| 999 | Municipal enterprise Chelyabinsk Bus Transport INN 7453222396 Chelyabinsk region Process of being wound up since 05.12.2016, signs of premeditated bankruptcy are detected |
40,7 | |
|
600 Insufficient |
| 1000 | Municipal enterprise of Nizhnii Novgorod Nizhegorodskii Passenger Road Transport INN 5260000192 Nizhnii Novgorod region |
-393,2 | |
|
291 Medium |
![]() — growth compared to prior period,
— growth compared to prior period, ![]() — decline compared to prior period.
— decline compared to prior period.
Average net assets of TOP-1000 companies tended to increase during the last decade (Picture 1).
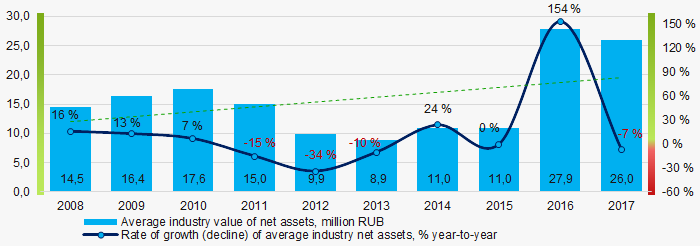 Picture 1. Change in average net assets of bus transportation companies in 2008 — 2017
The share of TOP-1000 companies with insufficiency of property is significant and tends to increase within the last 3 years (Picture 2).
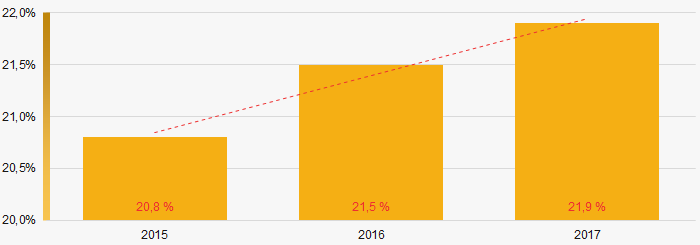 Picture 2. Share of TOP-1000 companies with negative value of net assets in 2015-2017
Sales revenue
In 2017 sales revenue of 10 leaders amounted to 53% of total revenue of TOP-1000 companies (Picture 3). This is an indicator of a high level of monopolization within the industry.
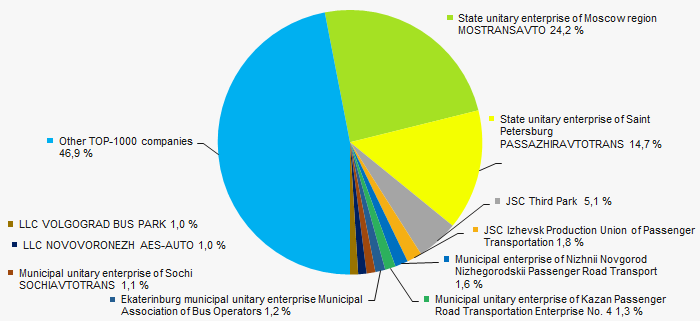 Picture 3. TOP-10 companies by their share in 2017 total revenue of TOP-1000 companies
In general, revenue tends to increase during the decade (Picture 4).
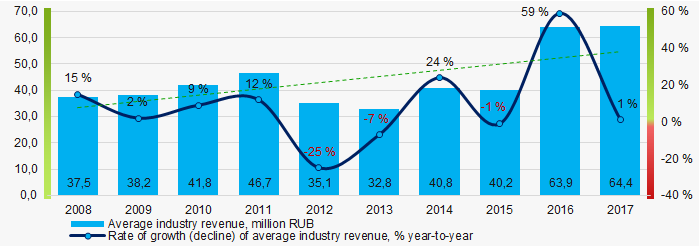 Picture 4. Change in average revenue of bus transportation companies in 2008 — 2017
Profit and loss
In 2017 profit of 10 industry leaders amounted to 25% of total profit of TOP-1000 companies (Picture 5).
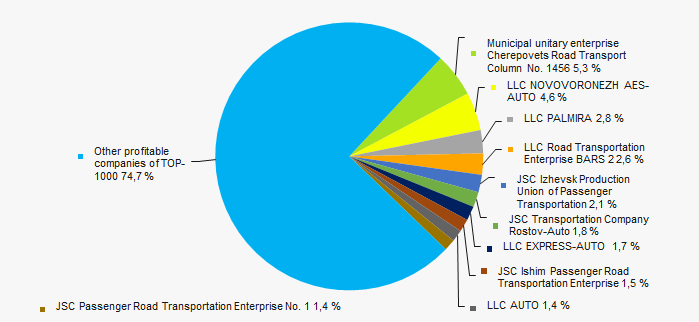 Picture 5. TOP-10 companies by their share in 2017 total profit"
Average net profit has mostly negative values, with a trend of the loss to increase (Picture 6).
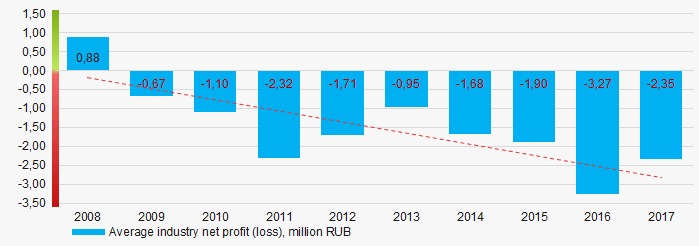 Picture 6. Change in average net profit (loss) of bus transportation companies in 2008 — 2017
Average net profit values of TOP-1000 companies within the last 3 years tend to increase slightly, and the average loss value decreases (Picture 6).
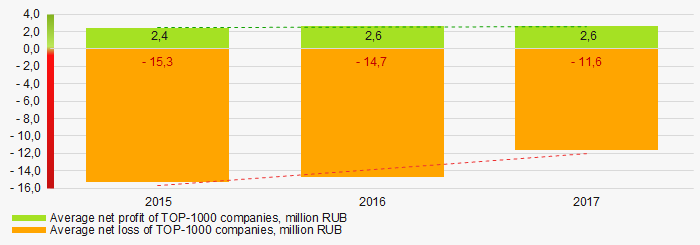 Picture 7. Change in average net profit and loss of TOP-1000 companies in 2015 — 2017
Key financial ratios
During the last decade average values of total liquidity ratio were below the recommended value — from 1,0 to 2,0, tending to decrease (Picture 8).
Total liquidity ratio (a ratio of current assets to current liabilities) reveals the sufficiency of a company’s funds for meeting its short-term liabilities.
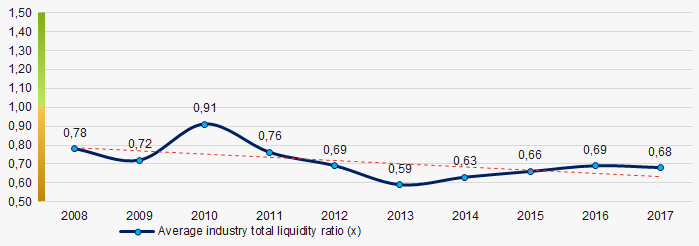 Picture 8. Change in average values of total liquidity ratio of bus transportation companies in 2008 — 2017
During the last decade, average values of return on investment ratio were in the negative area and tended to decrease (Picture 9).
It is a ratio of net profit to total equity and noncurrent liabilities, and it demonstrates benefit from equity engaged in business activity and long-term raised funds of the company.
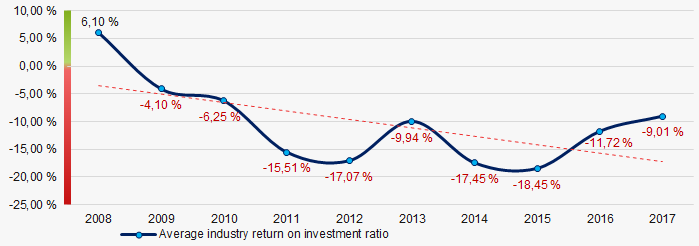 Picture 9. Change in average values of return on investment ratio of bus transportation companies in 2008 — 2017
Assets turnover ratio is a ratio of sales revenue to average total assets for the period, and it measures resource efficiency regardless of the sources. The ratio indicates the number of profit-bearing complete production and distribution cycles per annum.
During the last decade, this activity ratio tended to decrease (Picture 10).
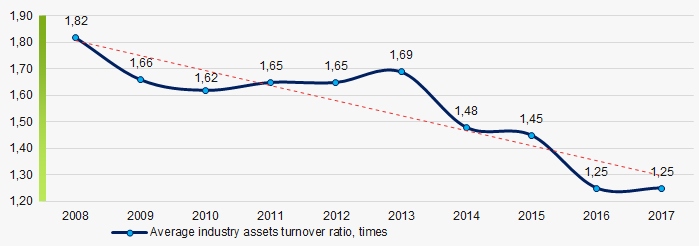 Picture 10. Change in average values of assets turnover ratio of bus transportation companies in 2008 — 2017
Structure of services
City and suburban passenger transportation companies have the largest share within the revenue of TOP-1000 (Picture 11).
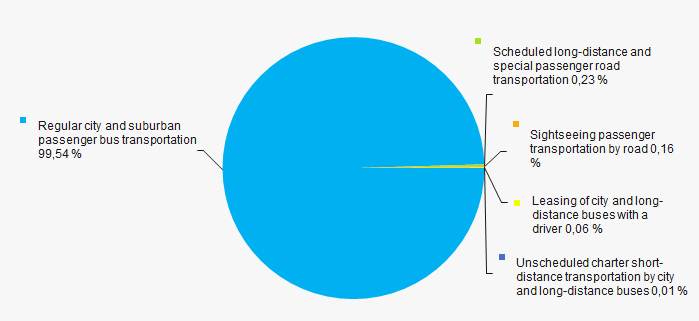 Picture 11. Types of activity by their share in total revenue of TOP-1000 companies
74% of TOP-1000 companies are included in the register of small and medium-sized businesses of the Federal Tax Service of the Russian Federation. In general, their share in total revenue of TOP-1000 in 2017 amounted to 22% (Picture 12).
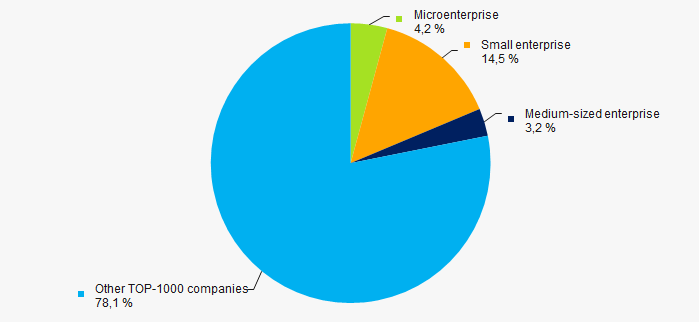 Picture 12. Shares of small and medium-sized enterprises in TOP-1000 companies' revenue, %
Key regions of activity
TOP-1000 companies are unevenly located throughout Russian territory, and are registered in 79 regions. Companies with the largest revenue are concentrated in the Moscow region and in Saint Petersburg (Picture 13).
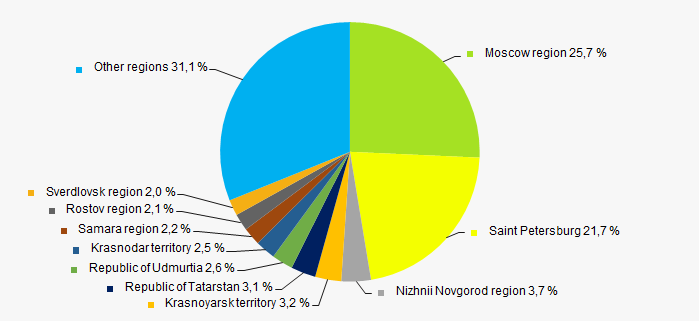 Picture 13. Revenue of TOP-1000 companies by Russian regions
Financial position score
Assessment of financial state of TOP-1000 companies indicates that over a half of the companies have an average financial standing (Picture 14).
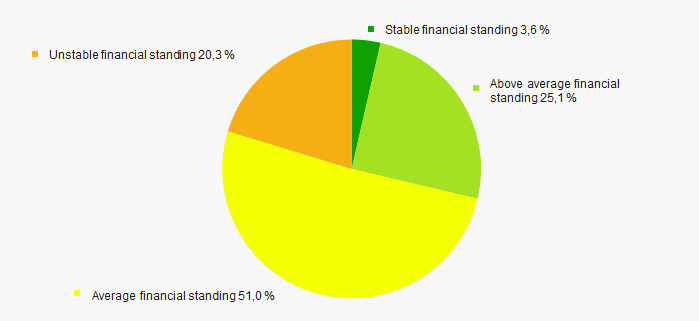 Picture 14. TOP-1000 companies by their financial position score
Solvency index Globas
The majority of TOP-1000 companies have got a superior, high, strong or medium Solvency index Globas, that indicates their capability to meet liabilities timely and in full (Picture 15).
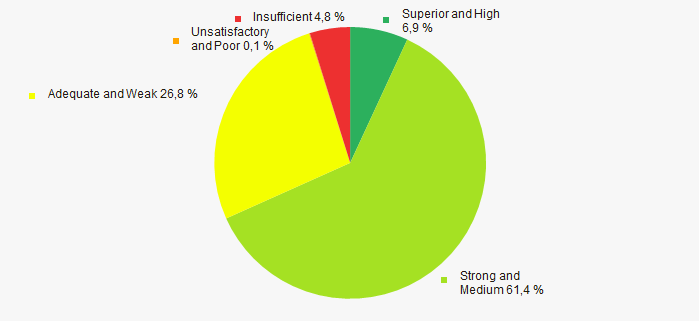 Picture 15. TOP-1000 companies by Solvency index Globas
Conclusion
A comprehensive assessment of the largest bus transportation companies, that considers key indexes, financial figures and ratios, is indicative of predominance of negative trends within the sector (Table 2).
| Trends and assessment factors | Relative share of the factor, % |
| Rate of growth (decline) of average industry net assets | |
| Increase/ Decrease of share of companies with negative net assets | |
| Rate of growth (decline) of average industry revenue | |
| Level of competition / monopolization | |
| Rate of growth (decline) of average industry net profit (loss) | |
| Increase/ Decrease of average industry net profit of TOP-1000 companies | |
| Increase/ Decrease of average industry net loss of TOP-1000 companies | |
| Increase/ Decrease of average industry total liquidity ratio | |
| Increase/ Decrease of average industry return on investment ratio | |
| Increase/ Decrease of average industry assets turnover ratio, times | |
| Share of small and medium-sized business within the industry by revenue over 30% | |
| Regional concentration | |
| Financial standing (majority share) | |
| Solvency index Glogas (majority share) | |
| Average factors' value | |
![]() — positive trend (factor),
— positive trend (factor), ![]() — negative trend (factor).
— negative trend (factor).