
Order a report
Custom-made industry research, company ratings, competitor analysis


Equity in fish processing
Information agency Credinform represents a ranking of the largest Russian enterprises engaged in processing and preserving fish and seafood. The companies with the largest volume of annual revenue (TOP-10) were selected for the ranking, according to the data from the Statistical Register for the latest available periods (2015 - 2017). They were ranked by equity turnover ratio (Table 1). The analysis was based on the data of the Information and Analytical System Globas.
Equity turnover (times) is revenue to the annual average total equity. It reflects the efficiency of the company’s equity management.
The ratio indicates the rate of equity turnover. High value speaks about effective equity management, and the low one is indicative of some equity idleness.
The experts of the Information agency Credinform, taking into account the actual situation both in the economy as a whole and in the sectors, has developed and implemented in the Information and Analytical system Globas the calculation of practical values of financial ratios that can be recognized as normal for a particular industry. For fish processing companies, the practical value of equity turnover ratio is from 3,74 times in 2017.
For the most complete and objective view of the financial condition of the enterprise, it is necessary to pay attention to the complex of indicators and financial ratios of the company.
| Name, INN, region | Revenue, million RUB | Net profit (loss), million RUB | Equity turnover, times | Solvency index Globas | |||
| 2016 | 2017 | 2016 | 2017 | 2016 | 2017 | ||
| 1 | 2 | 3 | 4 | 5 | 6 | 7 | 8 |
| TORGOVY DOM BALTIISKIY BEREG COMPANY LIMITED INN 7804500052 Saint Petersburg |
|
|
|
|
|
|
312 Adequate |
| LLC RUSSIAN FISH WORLD INN 5074018058 Moscow |
|
|
|
|
|
|
191 High |
| JSC OKEANRYBFLOT INN 4100000530 Kamchatka territory In process of reorganization by spin-off since 11.06.2019 |
|
|
|
|
|
|
194 High |
| JSC FISH PROCESSING PLANT №1 INN 7805024462 Saint Petersburg |
|
|
|
|
|
|
201 Strong |
| LLC VICHUNAI RUS INN 3911008930 Kaliningrad region |
|
|
|
|
|
|
198 High |
| JSC INDUSTRIAL AND BUSINESS ENTERPRISE MERIDIAN INN 7713016180 Moscow |
|
|
|
|
|
|
212 Strong |
| FGUP ARKHANGELSKOE AT THE FEDERAL PENITENTIARY SERVICE INN 3621005430 Saint Petersburg In process of reorganization in the form of transformation since 21.05.2018 |
|
|
|
|
|
|
198 High |
| LLC USTKAMCHATRYBA INN 4109002780 Kamchatka territory |
|
|
|
|
|
|
171 Superior |
| JSC OZERNOVSKY FISH CANNING PLANT №55 INN 4108003484 Kamchatka territory |
|
|
|
|
|
|
174 Superior |
| JSC RUSSIAN SEA INN 5031033020 Moscow region |
|
|
|
|
|
|
233 Strong |
| Total for TOP-10 companies | |
|
|
|
|||
| Average value for TOP-10 companies | |
|
|
|
|
|
|
| Industry average value | |
|
|
|
|
|
|
![]() — growth of indicator to the previous period,
— growth of indicator to the previous period, ![]() — decrease of indicator to the previous period.
— decrease of indicator to the previous period.
The average indicator of equity turnover ratio of TOP-10 companies is above the industry average and practical values. In 2017, three companies of TOP-10 increased their figures.
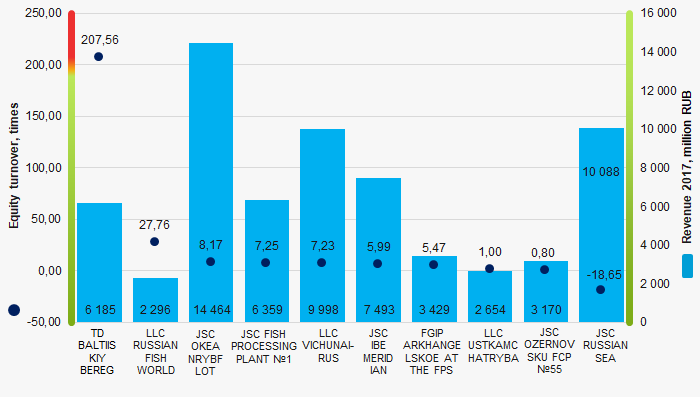 Picture 1. Equity turnover ratio and revenue of the largest Russian enterprises engaged in processing and preserving of fish and seafood (TOP-10)
Over the past 10 years, the values of equity turnover ratio have a trend to decrease (Picture 2).
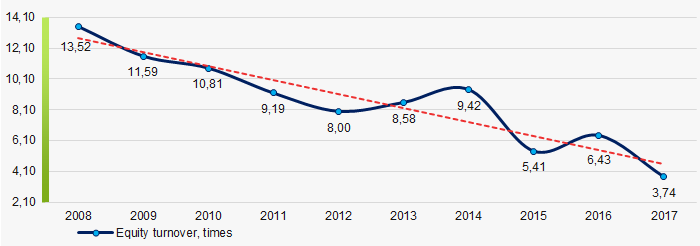 Picture 2. Change in the industry average values of equity turnover ratio of the largest Russian enterprises engaged in processing and preserving of fish and seafood in 2008 – 2017