Order a report
Custom-made industry research, company ratings, competitor analysis


The largest Russian manufacturers of metal pipes on the asset/liability ratio
Information agency Credinform prepared the ranking of Russian manufacturers of metal pipes. The companies with the highest volume of annual revenue involved in this industry (TOP-10) were selected for the ranking, according to the data from the Statistical Register for the latest available accounting periods (for 2015 and 2014). Then the enterprises were ranked by the asset/liability ratio (Table 1).
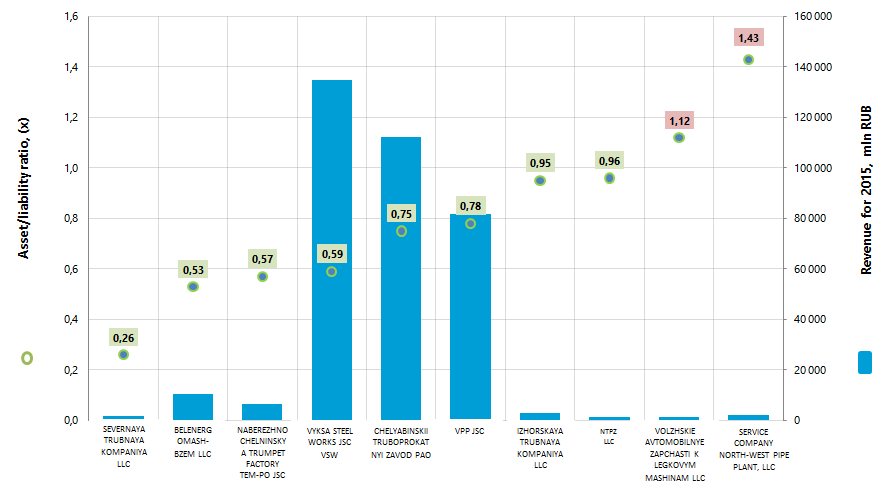
Asset/liability ratio (х) is calculated as the relation of long-term and short-term debts to the sum of the balance and points at the share of company's assets funded with loans.
The common recommended value of the index varies from 0,2 to 0,5, and the practical values calculated by the Information agency Credinform using an individual method, which takes into account the actual position of companies in a particular industry, varies from 0,4 to 1,0.
Exceedance of the upper standard value points to an excessive debt overburden, which can stimulate development, but have a negative impact on the stability of corporate finances. The index value, being lower than the standard value, can be indicative of a conservative strategy of financial management and an excess of caution in the attraction of new borrowings.
For getting of the most comprehensive and fair picture of the financial standing of an enterprise it is necessary to pay attention not only to compliance with standard values, but also to all combination of financial indicators and company’s ratios.
| Name | Net profit for 2015, mln RUB | Revenue for 2015, mln RUB | Revenue for 2015 by 2014, +/- % | Asset/liability ratio, (х) | Solvency index GLOBAS-i® |
|---|---|---|---|---|---|
| SEVERNAYA TRUBNAYA KOMPANIYA LLC INN 3528179640 Vologda region |
106,5 | 1 586,8 | 36 | 0,26 | 223 High |
| BELENERGOMASH-BZEM LLC INN 3123315768 Belgorod region |
2 703,4 | 10 430,4 | 75 | 0,53 | 232 High |
| NABEREZHNOCHELNINSKY A TRUMPET FACTORY TEM-PO JSC INN 1650233685 Republic of Tatarstan |
75,8 | 6 435,0 | 18 | 0,57 | 251 High |
| VYKSA STEEL WORKS JSC VSW INN 5247004695 Nizhny Novgorod region |
9 699,0 | 134 620,0 | 40 | 0,59 | 212 High |
| CHELYABINSKII TRUBOPROKATNYI ZAVOD PAO INN 7449006730 Chelyabinsk region |
5 389,0 | 112 285,3 | 16 | 0,75 | 200 High |
| VPP JSC INN 3435900186 Volgograd region |
9 325,1 | 81 897,1 | 41 | 0,78 | 179 The highest |
| IZHORSKAYA TRUBNAYA KOMPANIYA LLC INN 7817044086 Leningrad region |
21,2 | 2 752,1 | 18 | 0,95 | 232 High |
| NTPZ LLC INN 5031107088 Moscow region |
67,3 | 1 306,7 | 48 270 | 0,96 | 273 High |
| VOLZHSKIE AVTOMOBILNYE ZAPCHASTI K LEGKOVYM MASHINAM LLC INN 3435072207 Volgograd region |
-107,9 | 1 352,8 | 24 | 1,12 | 550 Unsatisfactory |
| SERVICE COMPANY NORTH-WEST PIPE PLANT, LLC INN 7811458845 Saint-Petersburg |
-72,2 | 2 076,8 | 18 | 1,43 | 314 Satisfactory |
| Total on the group of TOP-10 companies | 27 207,1 | 354 743,0 | 32* | 0,79* | |
| Total on the group of TOP-100 companies | 26 930,1 | 369 549,8 | 30* | 0,93* |
*) - the average value on the group of companies
The average value of the asset/liability ratio in the group of TOP-10 companies in 2015 is lower than in the group of TOP-100 companies, by the industry average value amounted to 0,71. At the same time, the indicator values of VOLZHSKIE AVTOMOBILNYE ZAPCHASTI K LEGKOVYM MASHINAM LLC and SERVICE COMPANY NORTH-WEST PIPE PLANT LLC do not fit into the intervals of recommended and practical values.
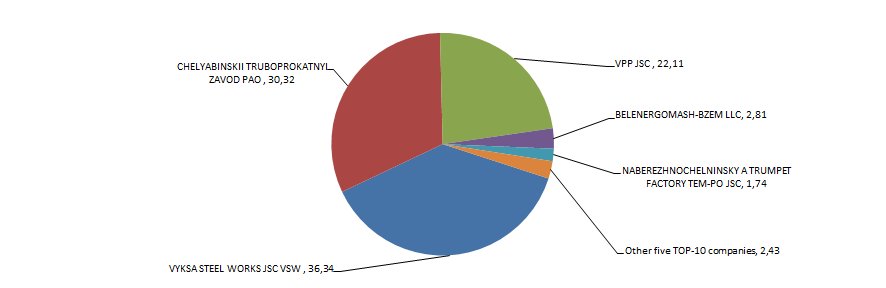
The volume of revenue of 10 the largest companies is 96% of the total revenue of 100 the largest enterprises. It points to a very high level of monopolization in this industry. In particular, the share of industry leaders - VYKSA STEEL WORKS JSC VSW and CHELYABINSKII TRUBOPROKATNYI ZAVOD PAO - in the total revenue of the group of TOP-100 companies for 2015 made about 67% cumulatively (Picture 2).
Eight of TOP-10 enterprises got the highest or high solvency index GLOBAS-i®, that points to their ability to repay their long-term debts timely and fully.
SEVERNAYA TRUBNAYA KOMPANIYA LLC got satisfactory solvency index GLOBAS-i®, due to the information on its participation as a defendant in arbitration court proceedings in terms of debt collection and to the loss in the structure of the balance sheet ratios. The forecast of ratio development remains stable, and credits require guarantees.
VOLZHSKIE AVTOMOBILNYE ZAPCHASTI K LEGKOVYM MASHINAM LLC got unsatisfactory solvency index GLOBAS-i®, due to the application for recognition of the company bankrupt. The probability of financial insolvency in the next 12 months is very high. The forecast of ratio development is negative, and credits are declined.
Three from TOP-10 companies (shown in red in Table 1) made a loss or reduction in the net profit in 2015 compared with the previous period. At the same time, all the enterprises, as well in the group of TOP-10, as in the group of TOP-100, created steadily the volumes of revenue in 2015.
Industry production indicators in physical terms in the period from 2011 to 2016 are not stable, as evidenced by the data calculated on the basis of the information of the Federal State Statistics Service (Picture 3). At the end of 11 months of 2016 there is a decline in production.
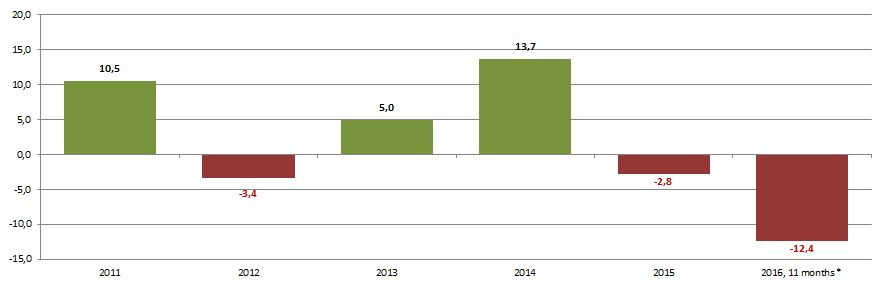
*) – data for 11 The rate of growth / decline in production of metal pipes in real terms from year to year months of 2016 are shown by corresponding period of 2015
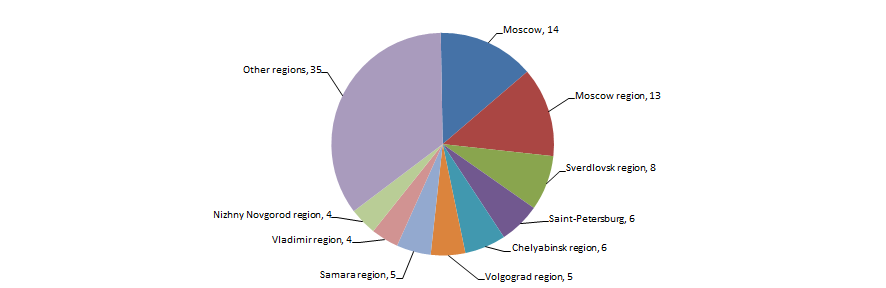
Companies, producing metal pipes, are spread relatively equally within the country’s territory and tend to industrial regions with well-developed infrastructure required for such energy-intensive and high-tech industry. This information is confirmed by the Information and analytical system Globas-i, according to which 100 the largest companies of the industry in terms of revenue for 2015 are registered in 30 regions of Russia (Picture 4).