
Order a report
Custom-made industry research, company ratings, competitor analysis


ТОP-10 of betting companies
Significant tax deductions aimed at the development of domestic sport are directed from the bookmakers to the budget. However, in 2020 the average return on costs of the TOP 10 bookmakers shows a decrease in income per ruble spent. At the same time, revenue and net profit demonstrated the growth.
Information agency Credinform has prepared a ranking of the betting companies. The largest enterprises (TOP-10) in terms of annual revenue were selected according to the data from the Statistical Register and the Federal Tax Service for the available periods (2018-2020). Then the companies were ranged by return on costs ratio (Table 1). The selection and analysis were based on the data from the Information and Analytical system Globas.
Our article dated 11.09.2019 will help to compare the current and 2018 results.
Return on costs (%) is the share of earnings before tax and the sum of production and sales costs. The ratio shows the income per ruble spent.
For the most full and fair opinion about the company’s financial position, the whole set of financial indicators and ratios of the company should be taken into account.
| Name, INN, region | Revenue, million RUB | Net profit (loss), million RUB | Return on costs, % | Solvency index Globas | |||
| 2019 | 2020 | 2019 | 2020 | 2019 | 2020 | ||
| 1 | 2 | 3 | 4 | 5 | 6 | 7 | 8 |
| LLC F.O.N. INN 9715010229 Moscow |
|
|
|
|
|
|
156 Superior |
| LLC RUS-TELETOT INN 7714156454 Moscow |
|
|
|
|
|
|
176 High |
| LLC FIRMA STOM INN 7705005321 Moscow |
|
|
|
|
|
|
163 Superior |
| LLC PYATIGORSKII IPPODROM INN 7705252264 Stavropol region |
|
|
|
|
|
|
241 Strong |
| LLC BK MARAFON INN 7701180668 Moscow |
|
|
|
|
|
|
165 Superior |
| LLC FORTUNA INN 6164205110 Rostov region |
|
|
|
|
|
|
212 Strong |
| JSC SPORTBET INN 7710310850 Moscow |
|
|
|
|
|
|
281 Medium |
| LLC 23BET.RU INN 5018092611 Moscow |
|
|
|
|
|
|
243 Strong |
| LLC ATLANTIK-M INN 7709424267 Moscow |
|
|
|
|
|
|
298 Medium |
| LLC KINOMANIYA INN 5836674770 Penza region |
|
|
|
|
|
|
390 Weak |
| Average value for TOP-10 companies | |
|
|
|
|
|
|
| Average industry value | |
|
|
|
|
|
|
![]() growth of indicator in comparison with prior period,
growth of indicator in comparison with prior period, ![]() decline of indicator in comparison with prior period
decline of indicator in comparison with prior period
In 2020, the average values of return on costs for TOP-10 companies are negative and lower than the industry average values. In 2020, five companies demonstrated the decline in indicators, in 2019 there were four companies like this.
At the same time, three companies showed the increase in revenue and five companies demonstrated the increase in net profit in 2020.
The TOP-10 average revenue increased by 12%, the industry average value increased by 13%.
The TOP-10 average profit increased by 19%, the industry average value - by 4%.
In general, during the last 5 years, the growth of average industry indicators of return on costs ratio was observed 3 times. The ratio reached its highest values in 2019, and the worst result is shown in 2016 (Picture 1).
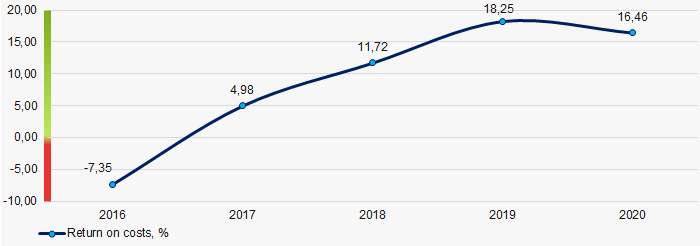 Picture 1. Change in average industry values of return on costs of the betting companies in 2016 – 2020