Information agency Credinform represents a ranking of the largest metallurgical companies in Chelyabinsk. Companies engaged in smelting of ferrous and non-ferrous metals, alloys, as well as the production of finished metal products with the largest volume of annual revenue (TOP 10 and TOP 100) were selected for the ranking, according to the data from the Statistical Register and the Federal Tax Service for the latest available periods (2018 - 2020). They were ranked by the solvency ratio (Table 1). The selection and analysis were based on the data of the Information and Analytical system Globas.
Credit period (days) is calculated as the ratio of the average amount of accounts payable for the period to sales revenue. The ratio shows how many days during the year the company repaid the average amount of its accounts payable.
The indicator reflects the process of repayment of debts to counterparties and is calculated to assess cash flows, which makes it possible to draw conclusions about the efficiency of the company and the chosen financial strategy.
The lower the indicator, the faster the company settles with its suppliers. Increased turnover can mean both problems with paying invoices and better organizing relationships with suppliers, providing more profitable, deferred payment schedule and using accounts payable as a source of cheap financial resources.
For the most complete and objective view of the financial condition of the enterprise, it is necessary to pay attention to the complex of indicators and financial ratios of the company.
Name, INN, activity | Revenue, billion RUB | Net profit (loss), million RUB | Credit period, days | Solvency index Globas | |||
2019 | 2020 | 2019 | 2020 | 2019 | 2020 | ||
1 | 2 | 3 | 4 | 5 | 6 | 7 | 8 |
LLC PRODUCTION AND COMMERCIAL FIRM INSSTAL INN 7411018984 zink production |
![]() |
![]() |
![]() |
![]() |
![]() |
![]() |
212 Strong |
JSC CHELYABINSK ELECTROMETALLURGICAL PLANT INN 7447010227 ferroalloys production |
![]() |
![]() |
![]() |
![]() |
![]() |
![]() |
196 High |
JSC CHELYABINSK ZINK PLANT INN 7448000013 production of lead, zinc and tin |
![]() |
![]() |
![]() |
![]() |
![]() |
![]() |
170 Superior |
JSC CHELYABINSK PROFILED STEEL FLOORING PLANT INN 7447014976 production of building metal structures, products and their parts |
![]() |
![]() |
![]() |
![]() |
![]() |
![]() |
204 Strong |
LLC BVK INN 7449106598 steel casting |
![]() |
![]() |
![]() |
![]() |
![]() |
![]() |
247 Strong |
JSC CHELYABINSK METALLURGICAL PLANT INN 7450001007 production of cast iron, steel and ferroalloys |
![]() |
![]() |
![]() |
![]() |
![]() |
![]() |
400 Weak |
JSC CHELYABINSKAVTOREMONT INN 7452032145 mechanical processing of metal products |
![]() |
![]() |
![]() |
![]() |
![]() |
![]() |
195 High |
JSC KONAR INN 7451064592 mechanical processing of metal products |
![]() |
![]() |
![]() |
![]() |
![]() |
![]() |
225 Strong |
JSC CHELYABINSK TUBE ROLLING PLANT INN 7449006730 production of steel pipes, hollow sections and fittings |
![]() |
![]() |
![]() |
![]() |
![]() |
![]() |
203 Strong |
JSC CHELYABINSK STEEL STRUCTURE PLANT INN 7449010952 production of building metal structures, products and their parts |
![]() |
![]() |
![]() |
![]() |
![]() |
![]() |
230 Strong |
Average value for TOP 10 | ![]() |
![]() |
![]() |
![]() |
![]() |
![]() |
|
Average value for TOP 100 | ![]() |
![]() |
![]() |
![]() |
![]() |
![]() |
growth of indicator to the previous period,
fall of indicator to the previous period
The average values of credit period of TOP 10 and TOP 100 were below the industry average ones.
Only four companies of TOP 10 increased their figures in 2020 compared to 2019. In 2019, the growth was recorded for seven companies.
In 2020, six companies included in TOP 10 gained revenue and four companies gained net profit. A 13% and 12% fell of the average revenue was recorded for TOP 10 and TOP 100 respectively. The average profit of TOP 10 and TOP 100 fell 45% and 43% respectively.
Over the past five years, the average values of credit period have increased constantly (Picture 1).
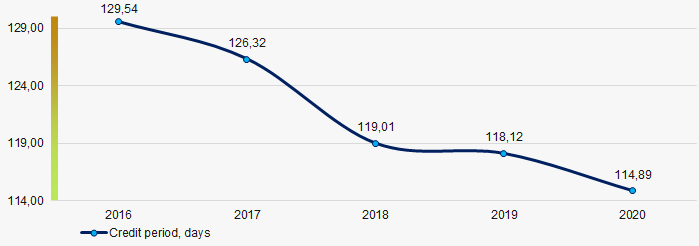
Information agency Credinform has prepared a review of trends in activity of the recruiting agencies. The largest companies (TOP-1000) in terms of annual revenue were selected according to the data from the Statistical Register and the Federal Tax Service for the latest available periods (2011 – 2020). The company selection and analysis were based on data of the Information and Analytical system Globas.
Net assets is a ratio reflecting the real value of company's property. It is calculated annually as the difference between assets on the enterprise balance and its debt obligations. The ratio is considered negative (insufficiency of property), if company’s debt exceeds the value of its property.
The largest company in terms of net assets is LLC EDINYI MIGRATSIONNYI TSENTR, INN 7842421041, St. Petersburg, activities of insurance agents and brokers. In 2020 net assets of the company amounted to more than 4,4 billion RUB.
The smallest size of net assets in TOP-1000 had Exect Partners Group Limited Liability Company, INN 7710734513, Moscow, activities of employment placement agencies. The lack of property of the company in 2020 was expressed in negative terms -387 million RUB.
For the last ten years, the average industry values of net assets and growth rates showed the upward tendency (Picture 1).
For the last five years, the share of ТОP-1000 enterprises with lack of property demonstrated the positive decreasing trend (Picture 2).
Sales revenue
In 2020, the total revenue of 10 largest companies amounted to 27% from ТОP-1000 total revenue (Picture 3). This fact testifies the relatively high level of competition among companies of this type of activity.
Within the last ten years, the decreasing trend in sales revenue with upward dynamics of growth rates is observed (Picture 4).
Profit and loss
The largest company in terms of net profit is also LLC EDINYI MIGRATSIONNYI TSENTR, INN 7842421041. The company’s profit amounted to almost 193 million RUB.
For the last ten years, the average profit values and growth rates show the decreasing tendency (Picture 5).
Over a five-year period, the average net profit (loss) values of ТОP-1000 show the negative tendency (Picture 6).
Main financial ratios
For the last ten years, the average values of the current liquidity ratio were within the recommended values - from 1,0 to 2,0, with growing trend (Picture 7).
The current liquidity ratio (ratio of total working capital to short-term liabilities) shows the sufficiency of company’s assets to meet short-term obligations.
Within ten years, the decreasing trend of the average values of ROI ratio is observed (Picture 8).
The ROI ratio is calculated as a ratio of net profit to sum of stockholder equity and long-term liabilities and shows the return from equity involved in commercial activities and long-term borrowed funds.
Assets turnover ratio is the ratio of sales revenue and company’s average total assets for a period. It characterizes the effectiveness of using of all available resources, regardless the source of their attraction. The ratio shows how many times per year the full cycle of production and circulation is performed, generating the corresponding effect in the form of profit.
For the last ten years, this business activity ratio demonstrated the decreasing trend (Picture 9).
Small businesses
89% of ТОP-1000 companies are registered in the Unified register of small and medium-sized enterprises of the Russian Federal Tax Service. Herein, their share in TOP-1000 total revenue amounted to more than 51%, which is 2,5 times higher than the national average value in 2018 – 2019 (Picture 10).
Main regions of activity
TOP-1000 companies are registered in 66 regions of Russia (this is 78% of territorial subjects of the Russian Federation) and are unequally located across the country. Almost 68% of the largest enterprises in terms of revenue are located Moscow and St.Petersburg (Picture 11).
Financial position score
An assessment of the financial position of TOP-1000 companies shows that the largest part has the average financial position (Picture 12).
Solvency index Globas
Most of TOP-1000 companies got superior/high and strong/medium Solvency index Globas, this fact shows the ability of the companies to meet their obligations in time and fully (Picture 13).
Conclusion
A complex assessment of the largest recruiting agencies demonstrates the presence of positive trends within 2011-2020 (Table 1).
Trends and assessment factors | Relative share, % |
Dynamics of average net assets value | ![]() |
Growth/drawdown rate of average net assets value | ![]() |
Increase / decrease in the share of enterprises with negative net assets | ![]() |
The level of monopolization / competition | ![]() |
Dynamics of average revenue | ![]() |
Growth/drawdown rate of average revenue | ![]() |
Dynamics of average profit (loss) | ![]() |
Growth/drawdown rate of average profit (loss) | ![]() |
Increase / decrease in average net profit | ![]() |
Increase / decrease in average net loss | ![]() |
Increase / decrease in average values of current liquidity ratio | ![]() |
Increase / decrease in average values of ROI ratio | ![]() |
Increase / decrease in average values of assets turnover ratio, times | ![]() |
Share of small and medium-sized businesses by revenue more than 20% | ![]() |
Regional concentration | ![]() |
Financial position (the largest share) | ![]() |
Solvency index Globas (the largest share) | ![]() |
Average value of factors | ![]() |
favorable trend (factor),
unfavorable trend (factor)