
Order a report
Custom-made industry research, company ratings, competitor analysis


Who will work?
In 2000s, the generation of the 80s promoted the growth potential of the labor force. However, it is completely exhausted by now. Taking into account the demographic problems of the 90s, the dynamics will get worse. How and where to look for labor resources?
In 2020, 74,8 million people aged from 15 to 72 formed the working-age population. There is a 1,9 million decrease in the value of the labor force for the past 5 years. In 2015, the Republic of Crimea and Sevastopol promoted the increase in value, but the negative dynamics has been observing for straight 9 years since 2012.
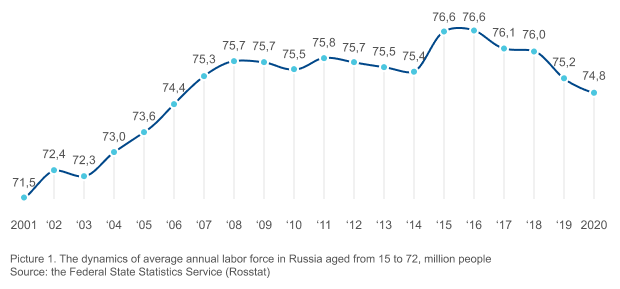 Picture 1. The dynamics of average annual labor force in Russia aged from 15 to 72, million people
Source: the Federal State Statistics Service (Rosstat)
Problems of the Russian labor market
Along with a shrinking and aging working-age population, the Russian companies will face the following staffing problems, including overabundance of labor force in some professions and an acute shortage of it in others. Today in Russia there is a shortage of industrial, engineering, medical workers and IT professionals.
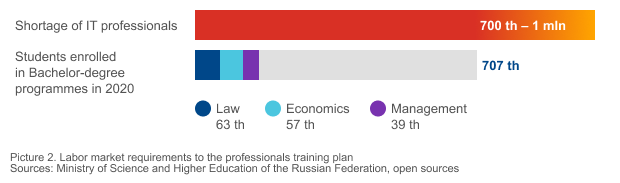 Picture 2. Labor market requirements to the professionals training plan
Sources: Ministry of Science and Higher Education of the Russian Federation, open sources
Replenishment of labor resources occurs mainly from the countries of the former USSR
From 2016 to 2020, 1,9 million people obtained Russian citizenship. Of these, 96,8% are from the ex-USSR countries.
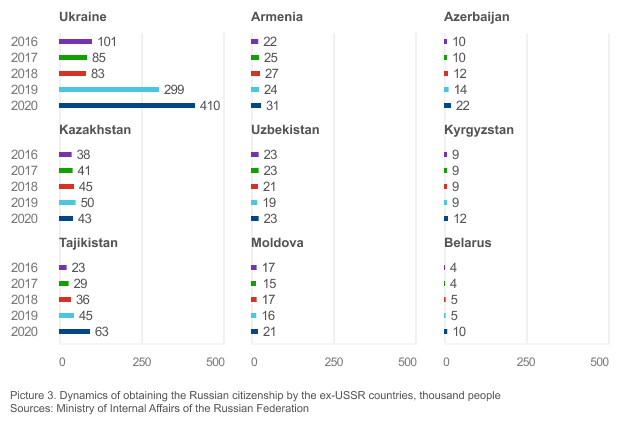 Picture 3. Dynamics of obtaining the Russian citizenship by the ex-USSR countries, thousand people
Sources: Ministry of Internal Affairs of the Russian Federation
In 2020, the post-Soviet record 410 thousand applicants from Ukraine received Russian citizenship. For 5 years, 978 thousand Ukrainian immigrants changed allegiance to Russian that is more than half of the total number of new citizens.
There are significantly fewer applicants from other countries.
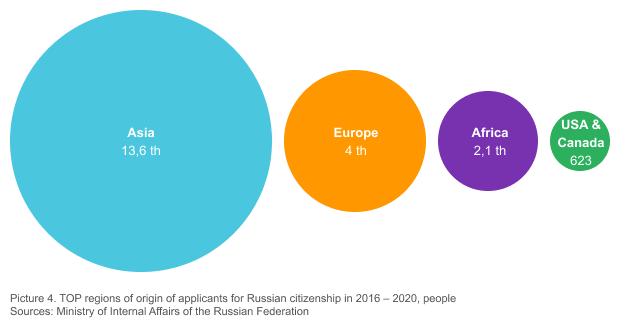 Picture 4. TOP regions of origin of applicants for Russian citizenship in 2016 – 2020, people
Sources: Ministry of Internal Affairs of the Russian Federation
Solutions
Realizing the complexity of the situation, the Russian authorities made unprecedented changes in the migration policy. Amendments were made to the Federal law of May 31, 2002 No. 62-FL "On the Citizenship of the Russian Federation". Since July 24, 2020, the most simplified procedure for obtaining Russian citizenship has been in effect for the citizens of Ukraine, Belarus, Kazakhstan and Moldova. Now it is enough to submit an appropriate application, while the condition of five years of continuous residence in the Russian Federation is canceled. Confirmation of the availability of livelihood, as well as renunciation of a second citizenship are not required. If the citizens of Ukraine and Belarus are recognized as a native speaker, an interview for knowledge of the Russian language has been cancelled for them from June 17, 2020.
Cancellation from July 24, 2020 for all foreign citizens of the mandatory requirement to renounce another citizenship upon entering the citizenship of the Russian Federation may additionally attract migrants, especially from the EU, the USA and Canada, where many of our former compatriots live. Renouncing foreign citizenship was a significant obstacle to moving to Russia, especially for people from relatively prosperous countries who do not want to fall out of touch with their second homeland.
The process of attracting the young people is in progress: all foreign students who were educated in Russian universities and have a labor experience in the country for at least 1 year can obtain Russian citizenship in a simplified procedure, without a five-year residence permit and confirmation of a legitimate source of livelihood.
The growth potential of those wishing to obtain Russian citizenship is high: according to the UN on 2019, in terms of the number of international migrants, Russia ranks 4th in the world.
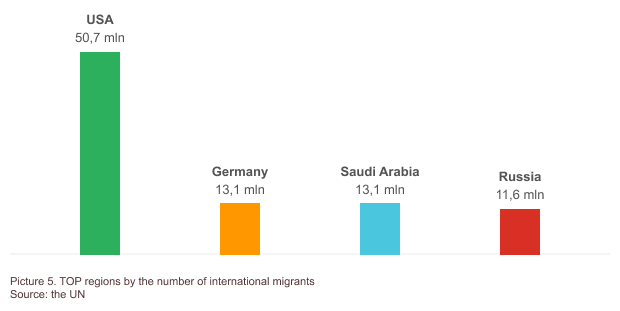 Picture 5. TOP regions by the number of international migrants
Source: the UN