
Order a report
Custom-made industry research, company ratings, competitor analysis


Trends in tourism activities
Information agency Credinform presents a review of activity trends of the largest Russian companies in the touristic field.
The largest travel agencies and other organizations providing travel services (TOP 1000) in terms of annual revenue for the last reporting periods available to the state statistics bodies and the Federal Tax Service (2015 – 2020*) were selected for the analysis. The selection of companies and the analysis were carried out based on data from the Information and Analytical system Globas.
Net assets – is a ratio that reflects the real value of the company's property that is calculated annually as the difference between the assets on the company's balance sheet and its debt obligations. The net asset ratio is negative (insufficient property) if the company's debt exceeds the value of its property.
The largest company in the TOP 1000 in terms of net assets is YUG-BUSINESSPARTNER LLC, INN 2311114861, Krasnodar Territory, service delivery activity related to the pre-orders services. In 2019 net assets accounted for over 3.3 billion RUB.
TT-TRAVEL LLC had the smallest net assets in the TOP 1000, INN 7714775020, Moscow, travel agencies activity.
Property insufficiency in 2020 was expressed by a negative value of -1.4 billion RUB.
Covering the five-year period average net assets of the TOP 1000 companies tend to decrease with negative growth rates (Picture 1).
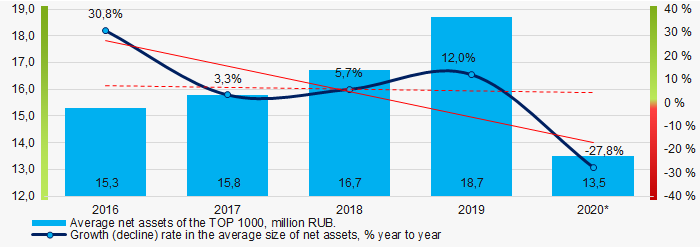 Picture 1. Change in average net assets ratios of the TOP 1000 in 2016-2019
Shares of companies with property insufficiency in the TOP 1000 had a negative trend to increase over the past five years (Picture 2).
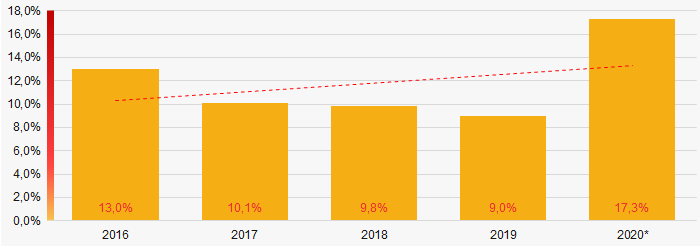 Picture 2. Shares of companies with negative net assets of the TOP 1000 in 2016-2019
Sales revenue
The revenue of the top ten companies in 2019 amounted to almost 45% of the total revenue of the TOP 1000 companies. (Picture 3). This indicates a high level of monopolization in the touristic industry.
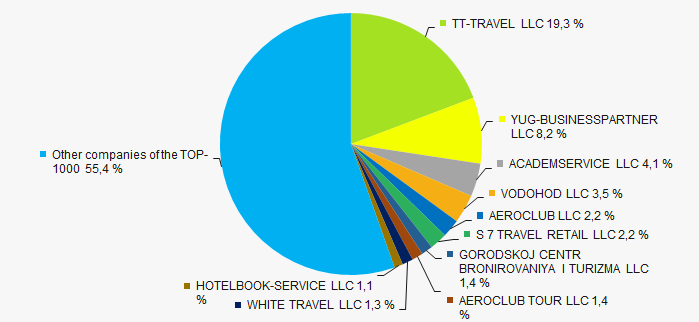 Picture 3. Shares of TOP 10 companies in the total revenue in 2019 TOP 1000
In general, there is a trend in revenue decreasing with decreasing growth rates (Picture 3).
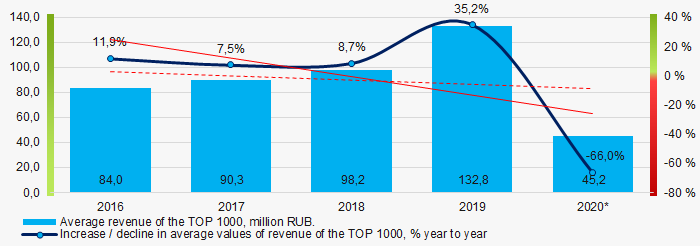 Picture 4. Changes in the average revenue of the TOP 1000 in 2016-2020.
Profit and loss
The largest company in the TOP 1000 in terms of net profit is PROMETHEJ AND MIR LLC, INN 7702516409, Moscow, travel agencies activity. Profit in 2020 amounted to 98 million RUB.
Covering the five-year period the average profit of the TOP 1000 tends to decrease, with decreasing growth rates (Picture 5).
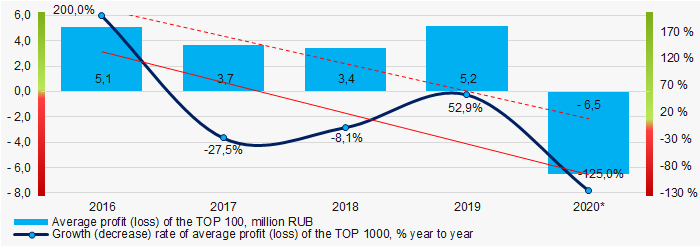 Picture 5. Change in average profit (loss) ratios of the TOP 1000 in 2016-2020.
Covering the past five years average values of net profit ratios of the TOP 1000 companies tend to decrease while average net loss increases. (Pictures 6).
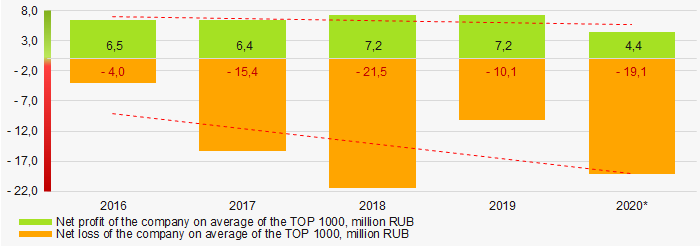 Picture 6. Changes in average values of the net profit and net loss ratios of the TOP 1000 companies in 2015-2020.
Key financial ratios
Covering the five-year period the current liquidity ratio average values of the TOP 1000 were significantly exceeding the range of recommended values - from 1.0 to 2.0 with a trend to increase. (Picture 7).
Current liquidity ratio (current assets to short-term liabilities) shows sufficiency of a company’s assets to settle short-term liabilities.
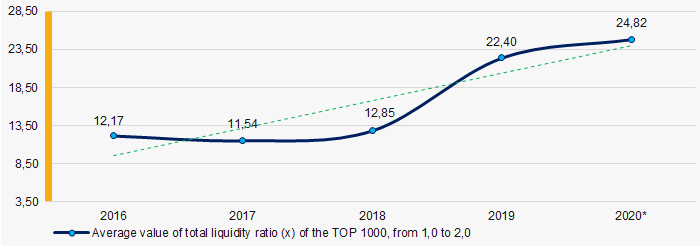 Picture 7. Changes in the current liquidity ratio average industry values of the TOP 1000 in 2016-2020.
Covering the five years period return on investments ratio average values of the TOP 1000 has been at a very high level with a trend to decrease (Picture 8).
This ratio is calculated as the ratio of net profit to amount of equity and long-term liabilities and demonstrates return on equity capital involved in commercial activities and the long-term funds raised by the organization.
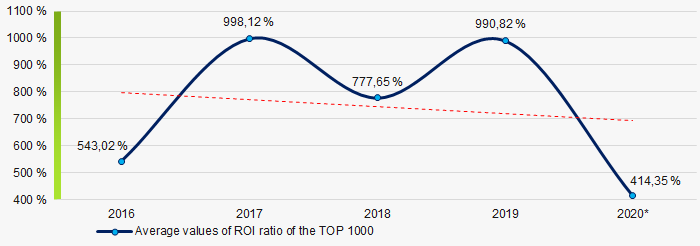 Picture 8. Change in return on investments ratio average values of the TOP 1000 in 2016-2020.
The asset turnover ratio is calculated as ratio of sales revenue to average value of total assets for a period and implicates the efficiency of use of all available resources, regardless of the sources they were raised. The ratio shows how many times per year the full cycle of production and turnover is performed generating the corresponding effect in the form of profit.
Covering the five-year period values of the said business activity ratio showed a trend to decrease (Picture 9).
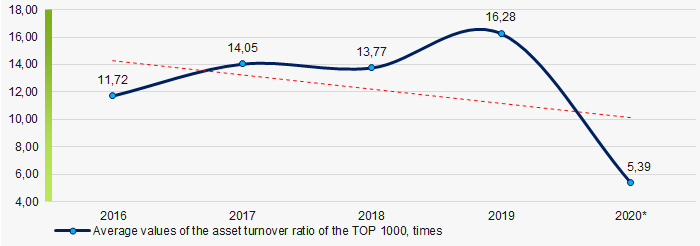 Picture 9. Change in asset turnover ratio average values of the TOP-1000 in 2016-2020.
Small Enterprises
95% of the TOP 1000 companies are registered in the Unified Register of Small and Medium-sized Enterprises of the Federal Tax Service of the Russian Federation. At the same time the share of their revenue in total of the TOP 1000 in 2019 is almost 53%, which is significantly higher than the national average in 2018-2019. (Picture 10).
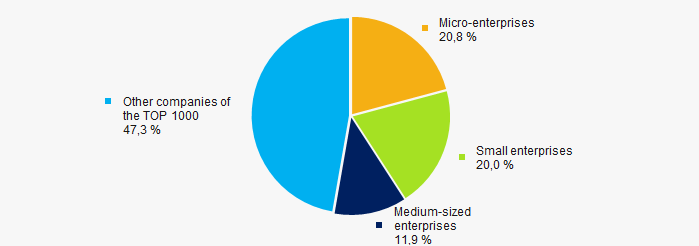 Picture 10. Revenue shares of small and medium-sized enterprises in TOP-1000
Main regions of activity
The TOP 1000 companies are registered in 72 regions and are distributed very unevenly across the country. Almost 59% of the total revenue of the TOP 1000 companies in 2019 is concentrated in Moscow (Picture 11).
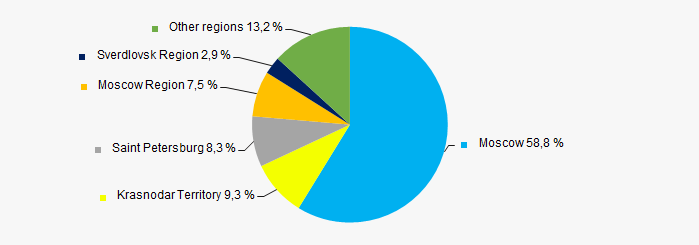 Picture 11. Distribution of TOP-1000 revenue by Russian regions
Financial position score
Financial position assessment of the TOP 1000 companies shows that the largest part of them is in average financial position. (Picture 12).
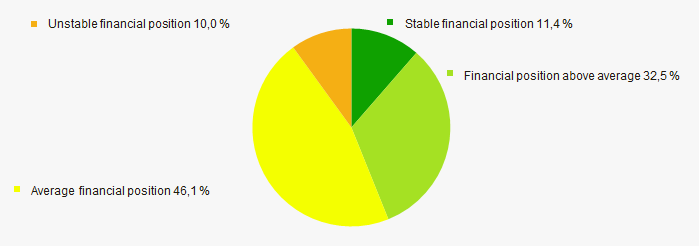 Picture 12. Distribution of TOP-1000 companies by Financial position score
Globas Solvency Index
The vast majority of the TOP-1000 companies are assigned the highest and high Globas Solvency Index. This indicates their ability to repay their debt liabilities on time and fully (Picture 13).
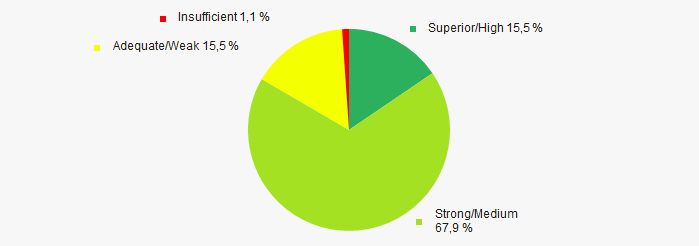 Picture 13. Distribution of TOP-1000 companies according to the Globas Solvency Index
 Conclusion
Comprehensive assessment of touristic companies’ activities that includes the main indexes, financial indicators and ratios shows predominance of negative trends in their activities in the period from 2015 to 2020. (Table 1).
| Trends and evaluation factors | Share of factor, % |
| Dynamics of average net assets value | |
| Increase (decline) rate in average size of net assets | |
| Enterprises share increase / decrease with net assets negative values | |
| Level of capital concentration | |
| Dynamics of average revenue | |
| Increase (decline) rate in average size of revenue | |
| Dynamics of the average profit (loss) | |
| Increase (decline) rate in average size of profit (loss) | |
| Increase / decline in average values of companies' net profit | |
| Increase / decline in average values of companies' net loss | |
| Increase / decrease in average values of overall liquidity ratio | |
| Increase / decrease in average values of return on investment ratio | |
| Increase / decrease in average values of asset turnover ratio, times | |
| Share of small and medium-sized enterprises in the region in terms of revenue exceeding 20% | |
| Regional concentration | |
| Financial position (the largest share) | |
| Globas Solvency Index (the largest share) | |
| Average value of factors share | |
![]() positive trend (factor),
positive trend (factor), ![]() negative trend (factor)
negative trend (factor)
(*) – the data in 2020 is provided for companies that reported to the Federal Tax Service of the Russian Federation before mid-April 2021.