
Order a report
Custom-made industry research, company ratings, competitor analysis


Trends in metal ore mining
Information agency Credinform has prepared a review of trends of the largest Russian metal ore mining companies.
The largest metal ore mining companies (TOP-10 and TOP-300) in terms of annual revenue were selected for the analysis according to the data from the Statistical Register for the latest available periods (2015-2017). The analysis was based on the data of the Information and Analytical system Globas.
Net assets are total assets less total liabilities. This indicator reflects the real value of the property of an enterprise. When the company’s debt exceeds the value of its property, the indicator is considered negative (insufficiency of property).
| № | Name, INN, region, activity | Net assets value, bln RUB | Solvency index Globas | ||
| 2015 | 2016 | 2017 | |||
| 1 | 2 | 3 | 4 | 5 | 6 |
| 1 | JSC MIKHAILOVSKY MINING AND PROCESSING PLANT INN 4633001577 Kursk region Open-pit iron ore mining |
112,4 | |
|
157 Superior |
| 2 | JSC STOILENSKY MINING AND PROCESSING PLANT INN 3128011788 Belgorod region Open-pit iron ore mining |
69,0 | |
|
193 High |
| 3 | JSC EVRAZ KACHKANARCKY ORE MINING AND PROCESSING PLANT INN 6615001962 Sverdlovsk region Open-pit iron ore mining |
67,7 | |
|
198 High |
| 4 | JSC KORSHYNOV MINING AND PROCESSING PLANT INN 3834002314 Irkutsk region Open-pit iron ore mining |
27,8 | |
|
184 High |
| 5 | JSC UCHALINSKY MINING AND PROCESSING PLANT INN 0270007455 Republic of Bashkortostan Copper ore mining and cleaning |
27,5 | |
|
231 Strong |
| 296 | JSC KRASNOKAMENSKY MINE INN 2423012272 Krasnoyarsk territory Open-pit iron ore mining In process of being wound up since 01.08.2016 |
-2,1 | |
|
600 Insufficient |
| 297 | JSC SALAIRSKY CHEMICAL ENTERPRISE INN 4204003399 Kemerovo region Mining of ore and precious metal sand (gold, silver, platinum group metals) |
-2,3 | |
|
369 Adequate |
| 298 | LLC KIMKANO-SUTARSKY MINING AND PROCESSING PLANT INN 7703525082 Jewish autonomous region Iron ore mining and cleaning |
-5,4 | |
|
296 Medium |
| 299 | LLC METALL-GROUP INN 7811122323 Belgorod region Iron ore underground mining In process of being wound up since 22.03.2018 |
-1,8 | |
|
600 Insufficient |
| 300 | LLC LUNSIN INN 5406332398 Republic of Tyva Mining and cleaning of other non-ferrous metal ore, n.e.c. |
-17,1 | |
|
317 Adequate |
![]() — growth of indicator in comparison with prior period,
— growth of indicator in comparison with prior period, ![]() — decrease of indicator in comparison with prior period.
— decrease of indicator in comparison with prior period.
For the last 10 years, the average values of net assets showed the increasing tendency (Picture 1).
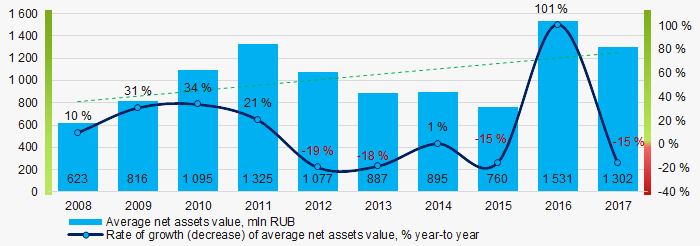 Picture 1. Change in average net assets value in 2008 – 2017
The shares of TOP-300 companies with insufficient property grow rapidly with the trend to increase over the past three years (Picture 2).
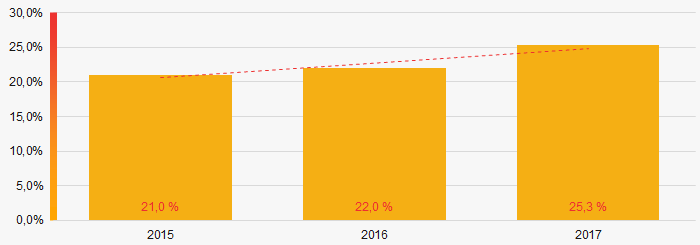 Picture 2. Shares of companies with negative net assets value in TOP-300, 2015 - 2017
Sales revenue
In 2017, total revenue of 10 largest companies in the industry was 67% of TOP-300 total revenue (Picture 3). This testifies high level of monopolization in the industry.
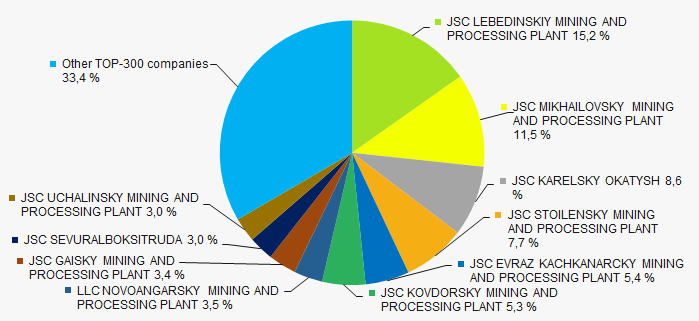 Picture 3. Shares of TOP-10 companies in TOP-300 total profit for 2017
In general, there is a trend to increase in industry average revenue over the past 10 years (Picture 4).
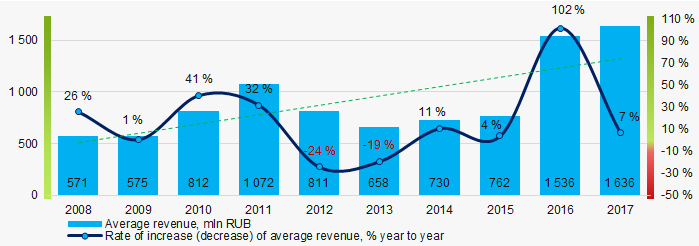 Picture 4. Change in industry average net profit in 2008-2017
Profit and loss
In 2017, profit of 10 largest companies in the region amounted to 87% of TOP-300 total profit (Picture 5).
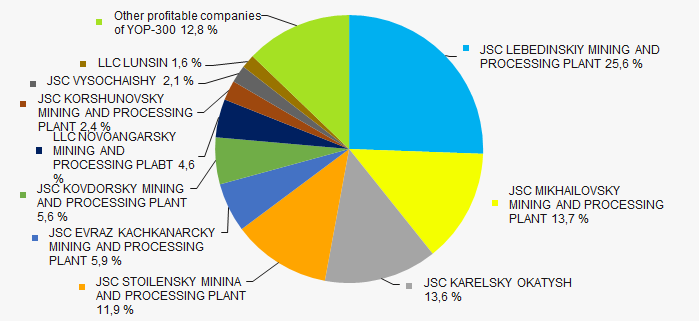 Picture 5. Shares of TOP-10 companies in TOP-300 total profit for 2017
For the last ten years, there is an increase of the industry average net profit values (Picture 6).
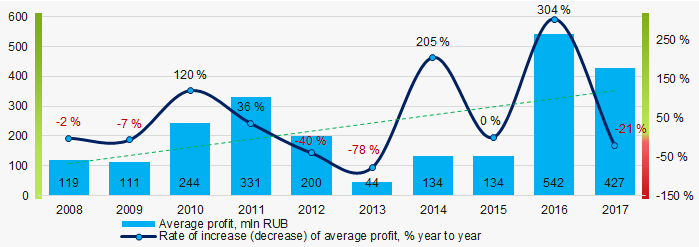 Picture 6. Change in industry average net profit (loss) in 2008-2017
For the three-year period, the average net profit values of TOP-300 companies show the increasing tendency with net loss decreasing (Picture 7).
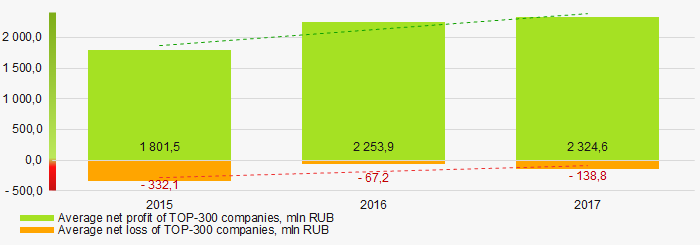 Picture 7. Change in average profit and loss of ТОP-300 in 2015 – 2017
Key financial ratios
For the last ten years, the average values of the current liquidity ratio were above the recommended one - from 1,0 to 2,0 with a trend to decrease (Picture 8).
Current liquidity ratio (current assets to short-term liabilities) shows the sufficiency of company’s assets to repay on short-term liabilities.
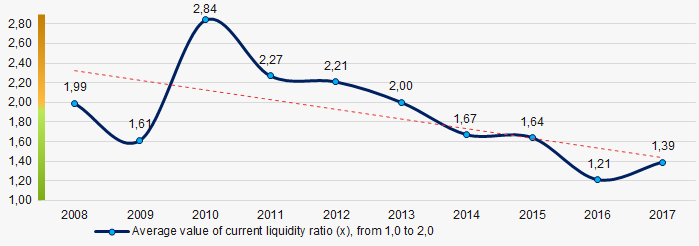 Picture 8. Change in industry average values of current liquidity ratio in 2008 – 2017
For the last ten years, relatively high level of ROI ratio with a trend to increase was observed (Picture 9).
ROI ratio is calculated as net profit to sum of shareholders equity and long-term liabilities, and shows the return of equity involved in commercial activities and long-term borrowed funds.
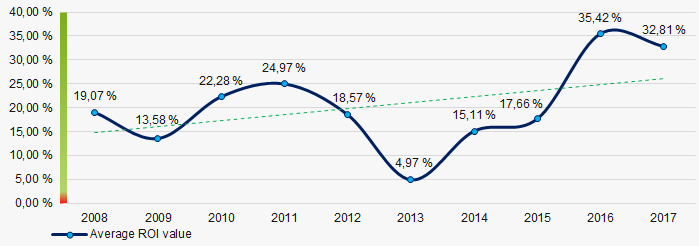 Picture 9. Change in average values of ROI ratio in 2008 – 2017
Assets turnover ratio is the ratio of sales revenue and company’s average total assets for a period. It characterizes the effectiveness of using of all available resources, regardless the source of their attraction. The ratio shows how many times per year the full cycle of production and circulation is performed, generating the corresponding effect in the form of profit.
For the last ten years, business activity ratio demonstrated the downward trend (Picture 10).
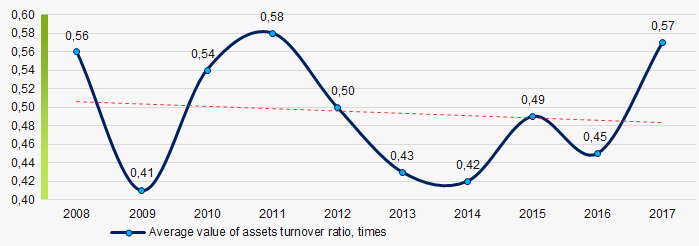 Picture 10. Change in average values of assets turnover ratio in 2008 – 2017
Production structure
The highest share in total revenue of TOP-300 falls for companies engaged in open-pit iron ore mining (Picture 11).
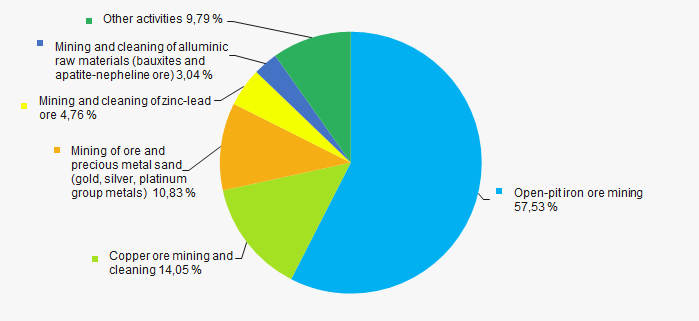 Picture 11. Distribution of activity types in total revenue of TOP-300, %
60% companies of TOP-300 are registered in the Register of small and medium-sized businesses of the Federal Tax Service of the Russian Federation. At the same time, their share in total revenue for 2017 amounted to only 0,97% (Picture 12).
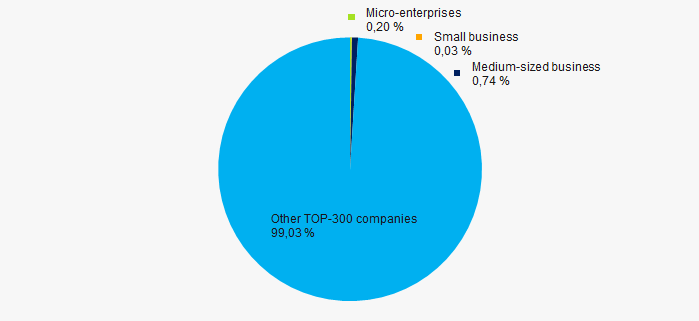 Picture 12. Shares of small and medium-sized enterprises in TOP-300, %
Main regions of activity
Companies of TOP-300 are located across the country extremely unequally, taking into account the location of sources. The companies are registered in 42 districts. The highest share of revenue volume is concentrated in Belgorod region (Picture 13).
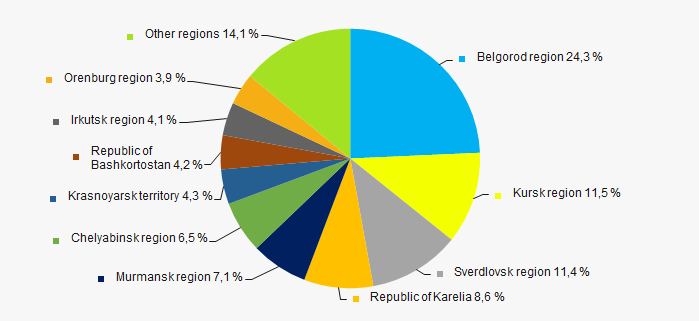 Picture 13. Distribution of TOP-300 revenue by districts of Russia
Financial position score
Assessment of the financial position of TOP-300 companies shows that the majority of them have unstable financial position (Picture 14).
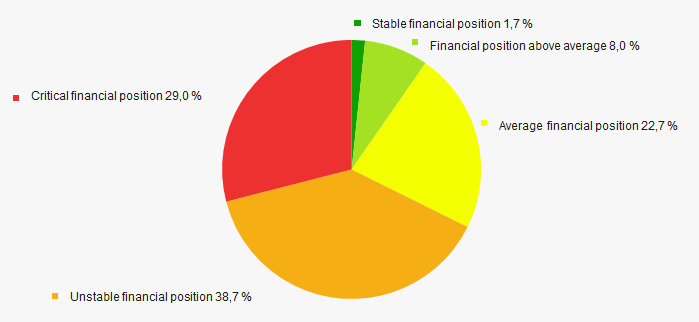 Picture 14. Distribution of TOP-300 companies by financial position score
Solvency index Globas
Most of TOP-300 companies got Adequate / Weak Solvency index Globas. This fact generally shows the ability to meet their obligations in time and fully (Picture 15).
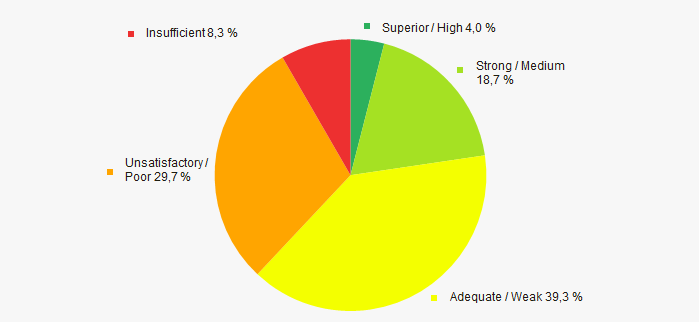 Picture 15. Distribution of TOP-300 companies by solvency index Globas
Index of industrial production
According to the Federal State Statistics Service (Rosstat), during 12 months of 2017 - 2018, the trend to decrease of industrial production indexes is observed. For 11 months of 2018, the index decreased by 1,7% at average, and increased by 0,9% for the period of December 2017 – November 2018 (Picture 16).
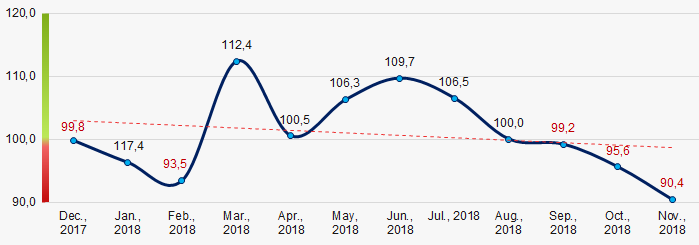 Picture 16. Index of industrial production of vehicles and equipment in 2017 – 2018, month-to-month (%)
Conclusion
Complex assessment of activity of the largest metal ore mining companies, taking into account the main indexes, financial ratios and indicators, demonstrates some prevalence of favorable trends (Table 2).
| Trends and evaluation factors | Relative share of factors, % |
| Rate of growth (decline) in the average size of net assets | |
| Increase / decrease in the share of enterprises with negative values of net assets | |
| Rate of growth (decline) in the average size of revenue | |
| Concentration level of capital | |
| Rate of growth (decline) in the average size of profit (loss) | |
| Growth / decline in average values of companies’ net profit | |
| Growth / decline in average values of companies’ net loss | |
| Increase / decrease in average values of total liquidity ratio | |
| Increase / decrease in average values of return on investment ratio | |
| Increase / decrease in average values of asset turnover ratio, times | |
| Share of small and medium-sized businesses in the region in terms of revenue being more than 30% | |
| Regional concentration | |
| Financial position (the largest share) | |
| Solvency index Globas (the largest share) | |
| Industrial production index | |
| Average value of relative share of factors | |
![]() — positive trend (factor),
— positive trend (factor), ![]() — negative trend (factor).
— negative trend (factor).