
Order a report
Custom-made industry research, company ratings, competitor analysis


Trends in the activity of the largest companies of real sector of economy of the Republic of Bashkortostan
Information agency Credinform Credinform has observed trends in the activity of the largest companies of real sector of economy of the Republic of Bashkortostan.
Enterprises with the largest volume of annual revenue (TOP-10 and TOP-1000), were selected for the analysis, according to the data from the Statistical Register for the latest available periods (for 2014-2016). The analysis was made on the basis of the data of the Information and Analytical system Globas.
Net assets — indicator, reflecting the real value of company’s property, is calculated annually as the difference between assets on the enterprise balance and its debt obligations. The indicator of net assets is considered negative (insufficiency of property), if company’s debt exceeds the value of its property.
| № in TOP-1000 | Name, INN, main type of activity | Net assets value, mln RUB | Solvency index Globas | ||
| 2014 | 2015 | 2016 | |||
| 1. | PJSOC Bashneft INN 274051582 Crude oil mining |
126 720 | |
|
208 Strong |
| 2. | AO TRANSNEFT – URAL INN 0278039018 Transportation of oil and oil products by pipeline |
93 660 | |
|
188 High |
| 3. | LLC BGK INN 0277077282 Production of electric power by heat power plants, including activities on working ability of electric power plants |
30 161 | |
|
145 Superior |
| 4. | LLC GAZPROM NEFTEKHIM SALAVAT INN 0266048970 Manufacture of oil products |
4 009 | |
|
276 Medium |
| 5. | AO UCHALINSKII GOK INN 0270007455 Mining and preparation of copper ore |
24 233 | |
|
193 High |
| 996. | JSC Housing Authority of Ordzhonikidze district INN 0277101778 Management of housing maintenance on a fee or a negotiable basis |
-544 | |
|
307 Adequate |
| 997. | JSC BASHKORTOSTAN SUBURBAN PASSENGER COMPANY INN 0278168302 Passenger suburban transportation by railway transport in controlled sector |
-1 063 | |
|
285 Medium |
| 998. | LLC BPK named after M.GAFURI INN 0263012454 Poultry breeding In bankruptcy proceeding |
89 | |
|
550 Insufficient |
| 999. | LLC ALFA-SOYUZ INN 0278083465 Lease and management of own or rented uninhabited immovable property |
-602 | |
|
307 Adequate |
| 1000. | LLC GLAVBASHSTROI INN 0245957140 Manufacture of concrete products for construction activities |
-1 932 | |
|
352 Adequate |
![]() — growth of the indicator to the previous period,
— growth of the indicator to the previous period, ![]() — decline of the indicator to the previous period.
— decline of the indicator to the previous period.
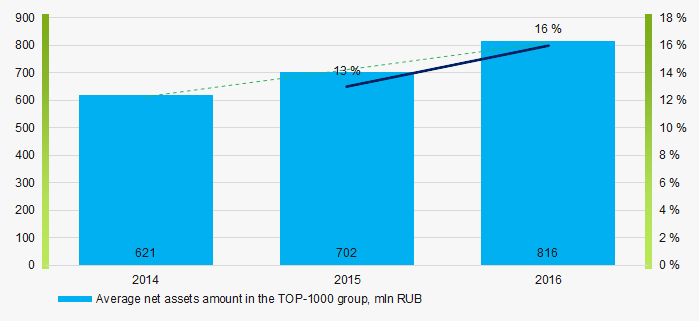 Picture 1. Change in TOP-1000 average indicators of the net asset amount in 2014 — 2016
Sales revenue
The revenue of 10 leaders of the industry made 43% of the total revenue of TOP-1000 companies in 2016. It demonstrates concentration of large companies in the Republic of Bashkortostan (Picture 2).
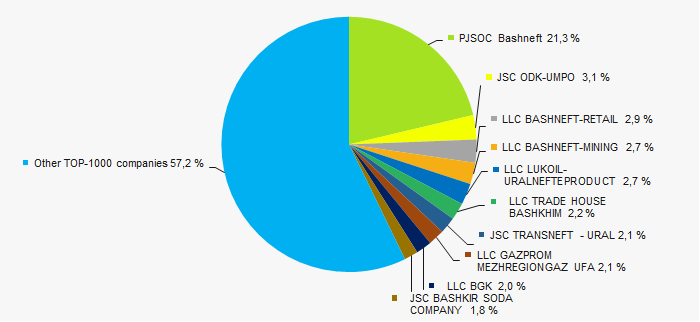 Picture 2. Shares of participation of TOP-10 companies in the total revenue of TOP-1000 companies for 2016
In general, a decreasing tendency in volume revenue is observed (Picture 3).
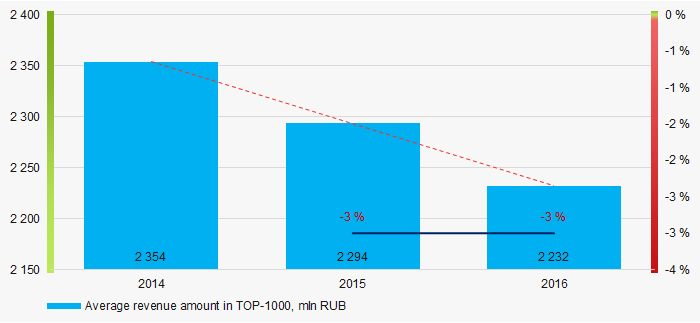 Picture 3. Change in the average revenue of TOP-1000 companies in 2014 — 2016
Profit and losses
The profit volume of 10 leading enterprises in 2016 made 63% of the total profit of TOP-1000 companies (Picture 4).
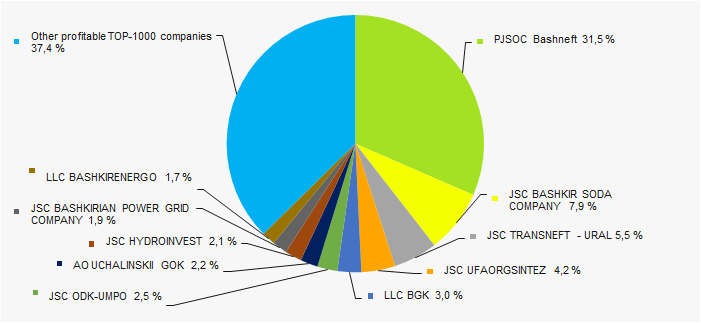 Picture 4. Share of participation of TOP-10 companies in the total volume of profit of TOP-1000 companies for 2016
Over a three-year period, the average values of profit indicators of TOP-1000 companies tend to increase. However, the average value of net loss decreases (Picture 5).
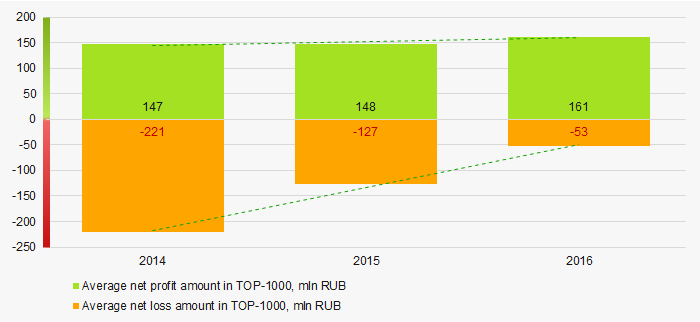 Picture 5. Change in the average indicators of profit and loss of TOP-1000 companies in 2014 — 2016
Key financial ratios
The current liquidity ratio (the relation of the amount of current assets to short-term liabilities) shows the sufficiency of company’s funds for repayment of its short-term liabilities.
Over the three-year period the average indicators of the current liquidity ratio were above the range of recommended values — from 1,0 up to 2,0 (Picture 6). In general, the ratio indicator tends to decrease.
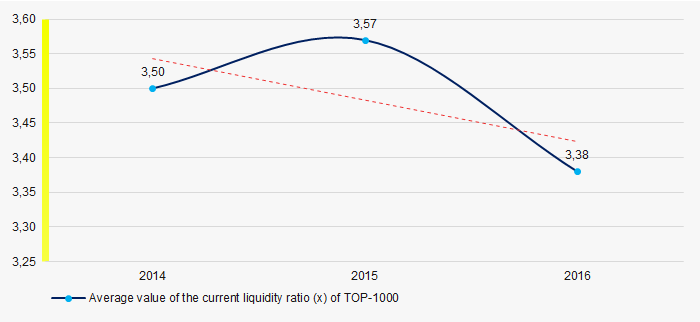 Picture 6. Change in the industry values of the current liquidity ratio of TOP-1000 companies in 2014 — 2016
The return on investment ratio is calculated as the relation of net profit to the sum of own capital and long-term liabilities and demonstrates the return on the equity involved in the commercial activity of own capital and the long-term borrowed funds of an organization.
Decreasing tendency in the indicators of the return on investment ratio has been observed for three years (Picture 7).
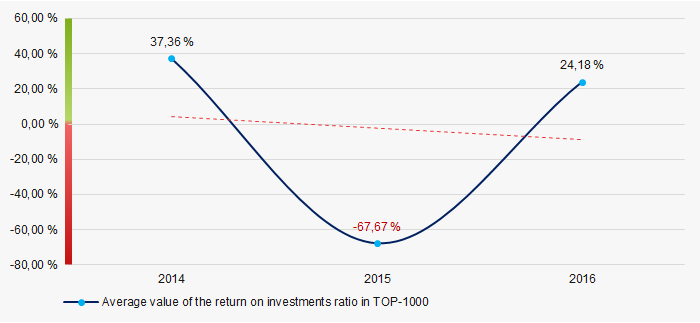 Picture 7. Change in the average values of the return on investment ratio of TOP-1000 companies in 2014 — 2016
Asset turnover ratio is calculated as the relation of sales revenue to the average value of total assets for a period and characterizes the efficiency of use of all available resources, regardless of the sources of their attraction. The ratio shows how many times a year a complete cycle of production and circulation is made, yielding profit.
This business activity ratio showed a tendency to decrease for a three-year period (Picture 8).
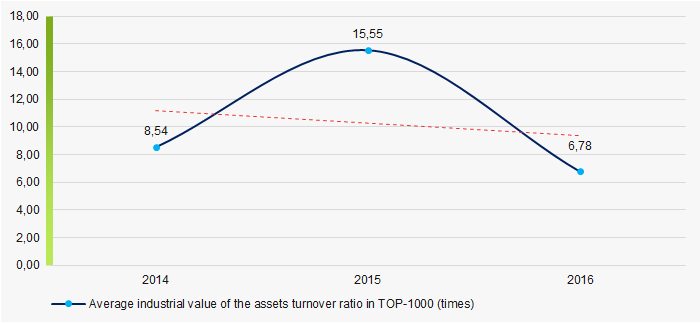 Picture 8. Change in the average values of the assets turnover ratio of TOP-1000 companies in 2014 — 2016
Production structure
The largest share in the total revenue of TOP-1000 is owned by companies, specializing in crude oil mining (Picture 9).
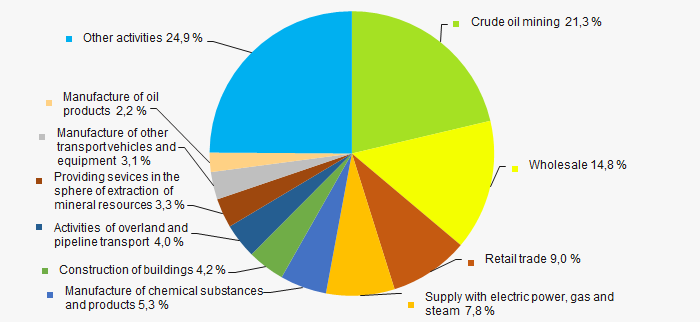 Picture 9. Distribution of companies by types of output in the total revenue of TOP-1000, %
61% of TOP-1000 companies are registered in the Register of small and medium enterprises of the Federal Tax Service of the RF (Picture 10).
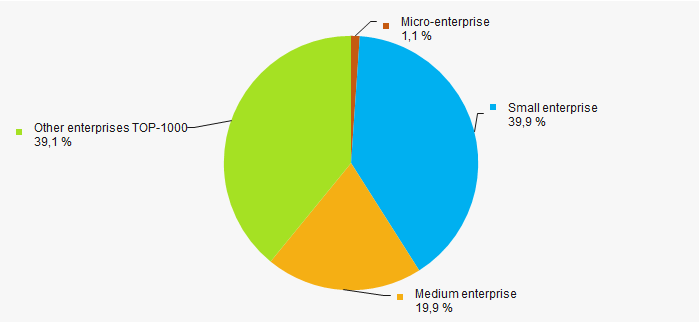 Picture 10. Shares of small and medium enterprises in TOP-1000 companies, %
Financial position score
An assessment of the financial position of TOP-1000 companies shows that the largest number is in a stable financial position and above the average (Picture 11).
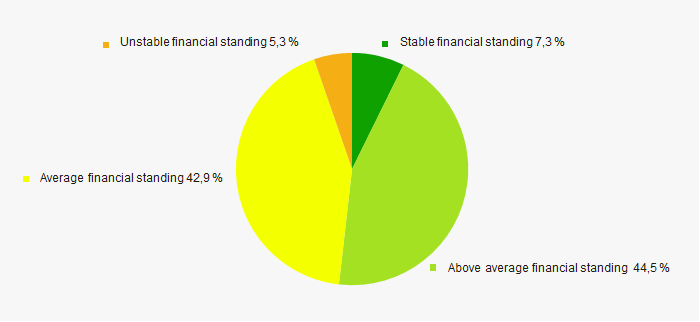 Picture 11. Distribution of TOP-1000 companies by financial position score
Solvency index Globas
Most of TOP-1000 companies have got from Superior to Medium Solvency index Globas, that points to their ability to repay their debts in time and fully (Picture 12).
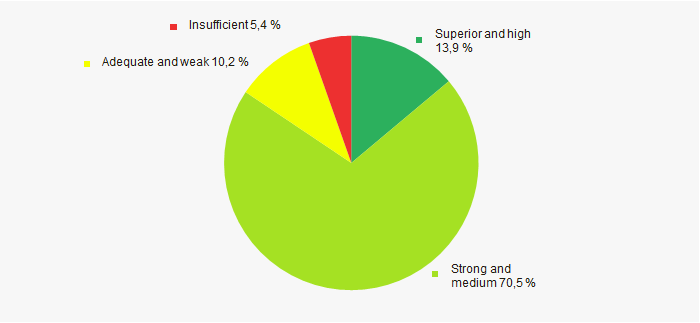 Picture 12. Distribution of TOP-1000 companies by Solvency index Globas
Conclusion
Comprehensive assessment of the activity of largest companies of real sector of economy of the Republic of Bashkortostan, taking into account the main indexes, financial indicators and ratios, demonstrates the presence of favorable trends. However, among disturbing factors are decreasing indicators of revenue volume and key financial ratios.