Solvency ratio of the largest Russian fishery enterprises
Information agency Credinform prepared a ranking of the major companies in the RF engaged in fishery.
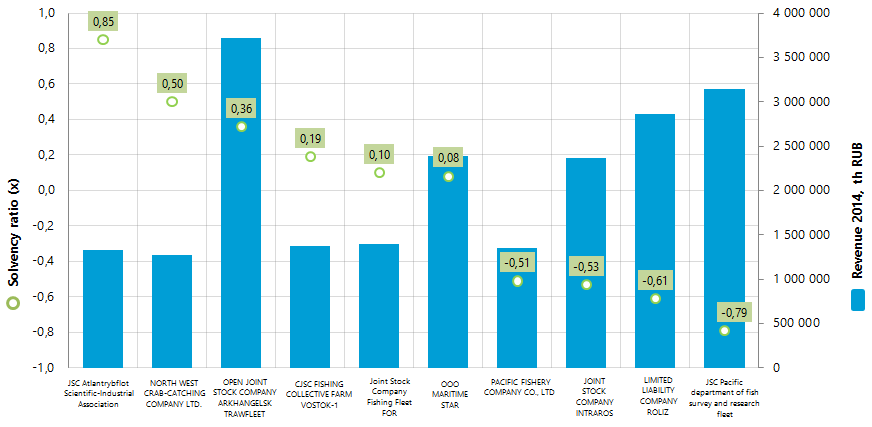
Companies with the highest volume of revenue were selected for this ranking according to the data from the Statistical Register for the latest available period (for the year 2014). The enterprises were ranked by decrease in solvency ratio (see table 1).
Solvency ratio (x) is equity capital to total assets. It shows the company's dependence on external loans. Recommended value: > 0.5.
The value below the minimum limit means high dependence on external sources of funds that could lead to a liquidity crisis and the precarious financial situation of the company in case of the worsening market conditions.
For the most complete and objective view of the financial condition of the enterprise it is necessary to pay attention not only to the average rates in the industry, but also to the presented set of financial indicators and ratios of the company.
| № | Name | Region | Revenue 2014 th RUB | Revenue2014 to 2013, %% | Solvency ratio (х) | Solvency index Globas-i® |
|---|---|---|---|---|---|---|
| 1 | JSC Atlantrybflot Scientific-Industrial Association INN 3905000203 |
Kaliningrad region | 1 328 400 | 131 | 0,85 | 178 The highest |
| 2 | NORTH WEST CRAB-CATCHING COMPANY LTD. INN 5190119530 |
Murmansk region | 1 268 763 | 168 | 0,50 | 173 The highest |
| 3 | OPEN JOINT STOCK COMPANY ARKHANGELSK TRAWFLEET INN 2901128602 |
Arkhangelsk region | 3 723 113 | 154 | 0,36 | 214 High |
| 4 | CJSC FISHING COLLECTIVE FARM VOSTOK-1 INN 2536010639 |
Primorye territory | 1 370 474 | 122 | 0,19 | 312 Satisfactory |
| 5 | Joint Stock Company Fishing Fleet FOR INN 3908021441 |
Kaliningrad region | 1 397 778 | 112 | 0,10 | 280 High |
| 6 | ООО MARITIME STAR INN 3903017709 |
Kaliningrad region | 2 386 716 | 135 | 0,08 | 230 High |
| 7 | PACIFIC FISHERY COMPANY CO., LTD INN 4909053889 |
Magadan region | 1 348 839 | 124 | -0,51 | 250 High |
| 8 | JOINT STOCK COMPANY INTRAROS INN 2537008664 |
Primorye territory | 2 371 015 | 121 | -0,53 | 261 High |
| 9 | LIMITED LIABILITY COMPANY ROLIZ INN 2536247860 |
Primorye territory | 2 866 516 | 133 | -0,61 | 296 High |
| 10 | JSC Pacific department of fish survey and research fleet INN 2536053382 |
Primorye territory | 3 140 046 | 108 | -0,79 | 283 High |
Solvency ratio of the largest Russian fishery enterprises (Top-10) varies from 0,85 to -0,79. The industry average value in 2014 was 0,26.
Solvency ratios of only two enterprises from the Top-10 meet the recommended norms: JSC Atlantrybflot Scientific-Industrial Association (x0,85) and NORTH WEST CRAB-CATCHING COMPANY LTD. (x0,50). These companies got the highest solvency index Globas-i. This indicates high ability to fulfil the debt liabilities.
Other Top-10 companies are highly depend on raise funds and have solvency index less than 0,5. Their capital does not cover the amount of liabilities. In case of lump-sum on credits the enterprises may have difficulties with repayment. Therefore, the companies in this sector need to proportion intentions to rapidly increase market presence under the reduction of competition of foreign companies to the ability to deal with high debt load.

According to the latest published annual financial statements for 2014, total annual revenue of the Top-10 companies amounted to 21,2 bln RUB, which is by 29% higher than the same companies’ figures in 2013. At the same time the growth rate of revenue of the Top-200 companies engaged in fishing industry over the same period was only 17%. This may indicates the concentration of the fish production in large companies and reduction in the number of small companies. For example, 8% of companies from the same Top-200 enterprises are at varying stages of reorganization or liquidation.
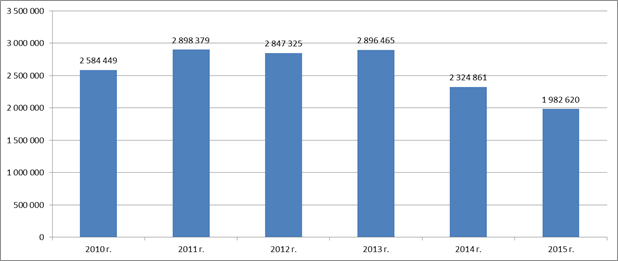
Rosstat data (Picture 2) show the reverse trend of reduction in physical volume of fish production in 2014 – 2015. Thus, the decrease in 2014 relative to 2013 was almost 20% and in 2015 to 2014 - almost 15%.
Picture 2. Production of live fish, fresh or chilled fish, frozen, chilled or fresh fillets in 2010 - 2015, tons (Rosstat data)

Leverage ratio of Russian outdoor clothes manufacturers
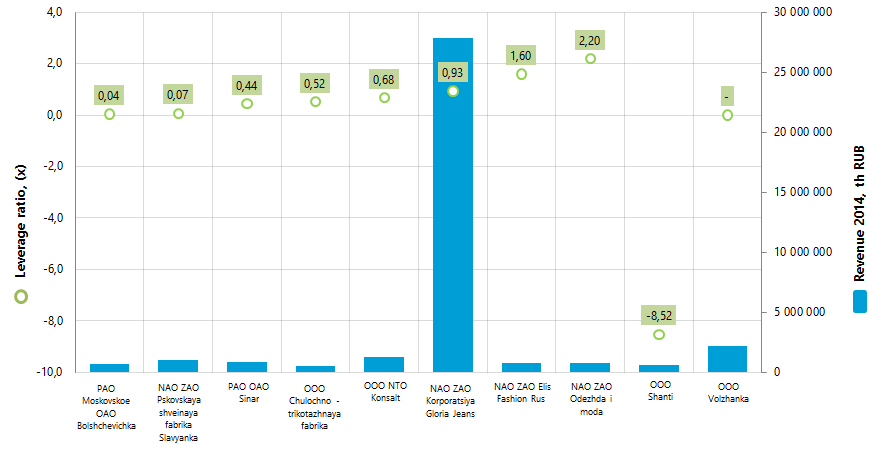
Information agency Credinform presents the ranking of Russian outdoor clothes manufacturers on leverage ratio. The largest by revenue companies in this industry for the last available in the Statistical register period (2014) were taken for the investigation. Further the Top-10 enterprises were ranked in the ascending order of leverage ratio value (Table 1).
Leverage ratio relates to the group of financial stability ratios. The group indicators are primarily of interest from the perspectives of long-term credits and investments possible provision, due to the fact that they characterize the company’s ability to meet its long-term liabilities. Thus leverage ratio is calculated as a ratio of total borrowed assets to net worth amount and shows how many units of borrowed assets were employed by the company on every unit of own funding sources.
Recommended value for the indicator under consideration is less than 1. At the same time debt/equity ratio can’t be negative therefore the ratio value from 0 to 1 is one of the indicators of company’s high ability to meet its liabilities.
| № п/п | Name, tax number | Region | Revenue 2013, th RUB | Revenue 2014, th RUB | Revenue 2014 to 2013, % | Leverage ratio, (х) | Solvency index Globas-i |
|---|---|---|---|---|---|---|---|
| 1 | PAO Moskovskoe OAO Bolshchevichka Tax number 7708029923 |
Moscow | 744 325 | 715 191 | 96 | 0,04 | 186 Highest |
| 2 | NAO ZAO Pskovskaya shveinaya fabrika Slavyanka Tax number 6027014530 |
Pskov region | 1 024 883 | 1 047 484 | 102 | 0,07 | 168 Prime |
| 3 | PAO OAO Sinar Tax number 5406014187 |
Novosibirsk region | 804 309 | 845 252 | 105 | 0,44 | 203 High |
| 4 | OOO Chulochno-trikotazhnaya fabrika Tax number 2130079012 |
Chuvash Republic | 492 470 | 519 477 | 105 | 0,52 | 260 High |
| 5 | OOO NTO Konsalt Tax number 4207048574 |
Kemerovo region | 1 274 720 | 1 245 517 | 98 | 0,68 | 167 Prime |
| 6 | NAO ZAO Korporatsiya Gloria Jeans Tax number 6166034397 |
Rostov region | 27 594 887 | 27 815 752 | 101 | 0,93 | 142 Prime |
| 7 | NAO ZAO Elis Fashion Rus Tax number 6152001000 |
Rostov region | 738 733 | 757 113 | 102 | 1,6 | 238 High |
| 8 | NAO ZAO Odezhda i moda Tax number 3728026176 |
Ivanovo region | 504 454 | 735 536 | 146 | 2,2 | 190 Prime |
| 9 | ООО Shanti Tax number 7730041122 |
Moscow | 149 924 | 609 827 | 407 | -8,52 | 280 High |
| 10 | ООО Volzhanka Tax number 6312119820 |
Samara region | - | 2 199 765 | - | - | 352 Satisfactory |
The analysis of the attained results showed that the leverage ratio of 6 companies from the TOP-10 satisfy the standards. The industry-average indicator in 2014 amounted to 1,39 which in the whole speaks for high debt load of industry enterprises.
All the TOP-10 companies except for OOO Volzhanka were given prime and high solvency index Globas-i®. It characterizes them as financially stable. For OOO Volzhanka the calculations weren’t made due to absence of the financial account for 2013.

NAO ZAO Korporatsiya Gloria Jeans is an ultimate industry leader – its revenue volume outweighs the volumes of the nearest competitors. It is placed on the sixth spot of the ranking with leverage indicator that equals 0,93, which satisfies the standards. The company was given the prime solvency index Globas-i®.
NAO ZAO Elis Fashion Rus and NAO ZAO Odezhda i moda showed the leverage ratio values that exceed 1, i.e. higher than the recommended ones. This result gives evidence to excess drawings, which can adversely affect companies’ solvency in future. However they were given high and prime solvency index Globas-i® by the complex of financial and nonfinancial indicators.
OOO Shanti showed the negative value of the leverage ratio (-8,52), which bespeaks the negative values in the company’s net worth structure. This enterprise managed to increase the revenue volume by a factor of 4 in 2014 in comparison with 2013 on account of gaining credit in 2013-2014. However it received the net loss for this period. Nevertheless the company was given the high solvency index Globas-i® by the complex of financial and nonfinancial indicators.
The total revenue volume of the TOP-10 companies for 2014 amounted to 36,5 billion RUB., which is by 3% greater than the same indicator for 2013 by comparable range of companies.
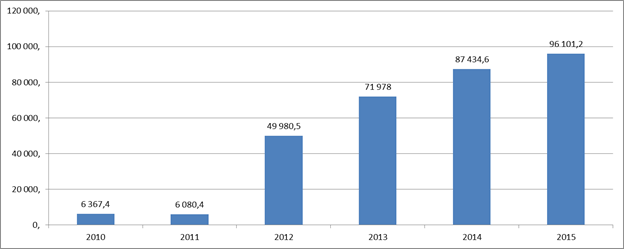
In the whole the industry of outdoor clothes manufacture in Russia shows high growth dynamic in the period from 2011 to 2015. The data of Rosstat (Federal State Statistics Service) indicates it in the figure 2.
