
Order a report
Custom-made industry research, company ratings, competitor analysis


Profitability of sales of the largest Russian retailers of household appliances
Information Agency Credinform has prepared the ranking of the largest Russian retailers of household appliances. The largest enterprises (TOP-10 and TOP-100) in terms of annual revenue were selected according to the data from the Statistical Register for the latest available periods (2015 and 2014). Then the companies were ranged by 2015 profitability of sales ratio (Table 1).
Profitability of sales (%) is the share of operating profit in the sales volume of the company. The ratio characterizes the efficiency of the industrial and commercial activity and shows the company’s funds, which remained, after covering the cost of production, interest and tax payments.
Profitability of sales ratio characterizes the efficiency of price policy and shows the ability of company's management to control the expenses. Differences in competitive strategies and product lines cause a substantial range of ratio values within companies of the same industry. Therefore it should be taken into account, that at equal values of revenue, operational expenses and profit before tax, the profitability of sales ratio of two companies can be significantly different, due to the influence of interest payments on net profit.
The calculation of practical values of financial indicators, which might be considered as normal for a certain industry, has been developed and implemented in the Information and Analytical system Globas-i®, by the experts of Information Agency Credinform, taking into account the actual situation of the economy as a whole and the industries. The practical value of profitability of sales ratio for retailers of household appliances starts from 4,78%.
For the most full and fair opinion about the company’s financial position, the whole set of financial indicators and ratios of the company should be taken into account.
| Name, INN, region | 2015 net profit, mln RUB | 2015 revenue, mln RUB | 2015/2014 revenue,% | Profitability of sales, % | Solvency index Globas-i® |
| LLC Group of Companies TSSINN 7702325027 Moscow | 170,5 | 1 227,8 | 35,6 | 16,55 | 164 The highest |
| LLC PROMELEKTRO INN 6122017764 Rostov region | 36,1 | 406,2 | 63,7 | 9,81 | 220 High |
| SFERA Company Limited INN 7811318767 Saint-Petersburg | 24,2 | 479,3 | -1,0 | 6,56 | 239 High |
| LLC TRADE HOUSE MIR INN 0541028003 Republic of Dagestan | 13,5 | 388,4 | 16,2 | 4,22 | 190 The highest |
| LLC TRADE HOUSE ENERGOSBYT INN 7813182222 Saint-Petersburg | 1,4 | 420,2 | 54,4 | 2,68 | 211 High |
| LLC V-LAZER INN 2540137652 Primorsky Krai | 20,7 | 3 424,5 | -27,5 | 1,18 | 265 High |
| LLC ARKTIKA INN 1501009790 Republic of North Ossetia-Alani | 11,6 | 889,4 | -19,0 | 1,03 | 232 High |
| LLC COLONNADA INN 6367659470 Samara region | 0,8 | 520,5 | -8,3 | 0,92 | 208 High |
| LLC ENERGOSBYT - EKATERINBURG INN 6674134266 Sverdlovsk region | 1,2 | 484,3 | -12,2 | 0,81 | 272 High |
| LLC TECHNOPARK - CENTRE INN 7715631511 Moscow | 97,8 | 8 664,6 | -6,9 | 0,30 | 239 High |
| Total for TOP-10 group of companies | 377,8 | 16 905,2 | |||
| Total for TOP-100 group of companies | 740,9 | 26 604,8 | |||
| Average value within TOP-10 group of companies | 37,8 | 1 690,5 | 8,5 | 4,41 | |
| Average value within TOP-100 group of companies | 7,4 | 266,0 | -5,2 | 6,28 | |
| Industry average value | 1,1 | 61,3 | -23,9 | 4,78 |
In 2015 the average value of profitability of sales ratio in TOP-10 group of companies is lower than practical value and in TOP-100 group of companies – it is higher (green and yellow colors respectively in Table 1 and Picture 1).
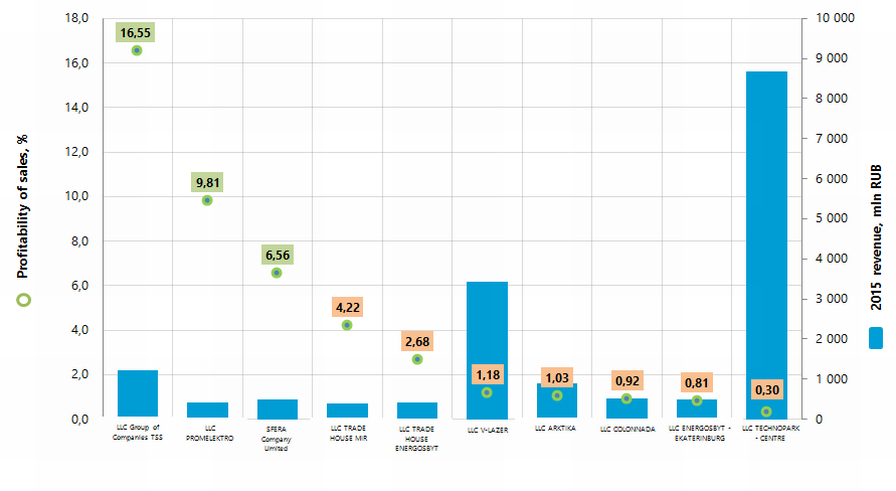 Picture 1. Profitability of sales ratio and revenue of the largest Russian retailers of household appliances (TOP-10)
In 2015 total revenue of 10 largest companies amounted to 64% from TOP-100 total revenue. This fact testifies rather high level of monopolization within industry. Thus, total revenue of the largest company within industry LLC TECHNOPARK - CENTRE amounted to 33% from TOP-100 total revenue (Picture 2).
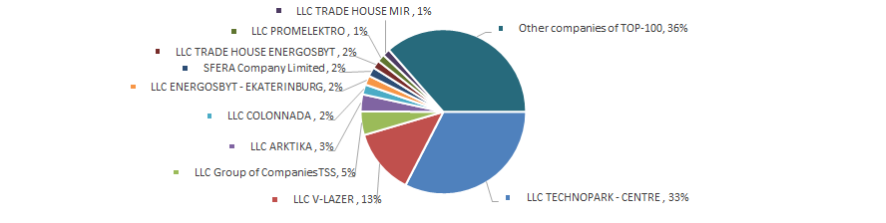 Picture 2. The shares of TOP-10 companies in TOP-100 total revenue for 2015, %
All companies from TOP-10 list have the highest or high solvency index Globas-i® this fact shows the ability of the companies to meet their obligations in time and fully.
In 2015 seven companies from TOP-10 have decrease in revenue or net profit in comparison with previous period (red color in Table 1).
In 2014 the TOP-100 list included 9 loss-making companies and in 2015 their number increased to 11. Meanwhile, their average loss increased more than twice. The average profit of other companies from TOP-100 list increased by almost 18% for the same period (Picture 3).
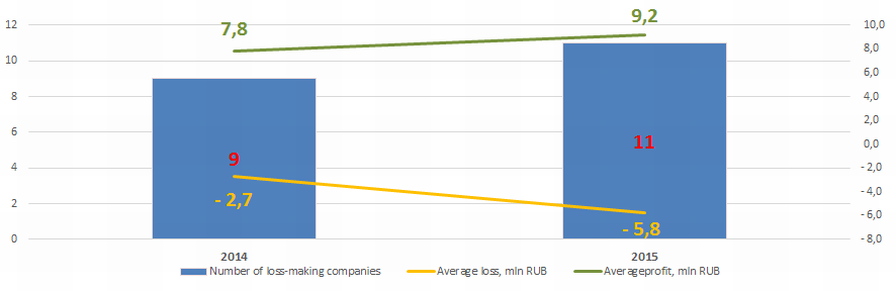 Picture 3. The number of loss-making companies and their average loss, average profit within TOP-100 group of companies in 2014 – 2015.
In 2015 seven companies from TOP-10 have decrease in revenue or net profit in comparison with previous period (red color in Table 1).
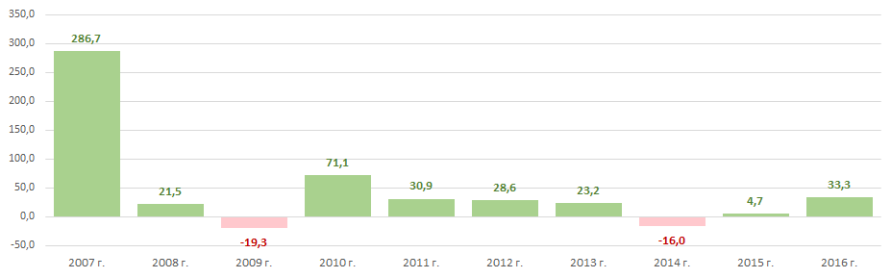
In general, the industry ratios of profitability of sales were within practical values in 2008, 2010, 2014 and 2015 (Picture 4), this indicates about relatively high level of activity efficiency of companies’ in the industry.
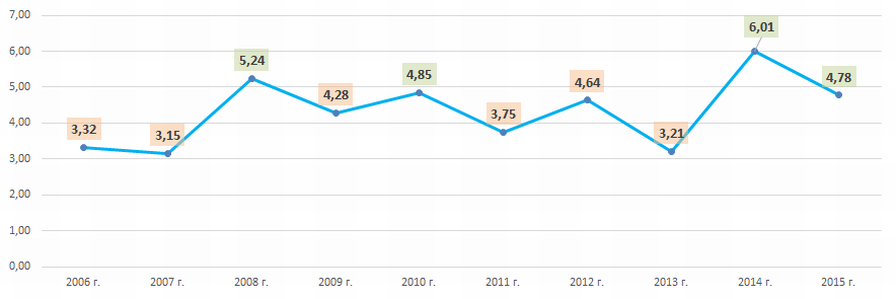 Picture 4. The industry average values of profitability of sales of the largest Russian household appliances retailers in 2006-2015
 In general, the industry ratios in monetary terms reflect macroeconomic trends; this testifies the data from the Federal State Statistics Service (Picture 5 and Table 2).
 Picture 5. The growth (decline) rate of retail trade of electrical household appliances in monetary terms, from year to year, %
For the last 10 years the greatest volume of retail trade of electrical household appliances was observed in 2016 (Table 2).
| Retail trade: | 2007 | 2008 | 2009 | 2010 | 2011 | 2012 | 2013 | 2014 | 2015 | 2016 |
| household appliances, radio and television goods | 134,8 | 163,7 | 132,0 | 225,8 | 295,5 | 379,9 | 467,9 | 393,3 | 411,6 | 548,6 |
| computers, software and peripheral devices ** | 15,7 | 13,2 | 14,1 | 20,3 | 31,2 | 46,3 | 37,1 | 42,4 | 54,5 | 78,0 |
| through television, radio, phone and Internet** | 1,0 | 2,1 | 2,5 | 3,3 | 4,7 | 7,3 | 21,9 | 22,3 | 19,1 | 57,9 |
*) in Table 2: red color - decline in trade volumes, green color - growth in trade volumes
**) data for reference
Retailers of household appliances are rather equally distributed across the country. The maximum concentration is observed in the regions with the largest and solvent population. This fact is confirmed by data from the Information and Analytical system Globas-i® according to which 100 largest companies in terms of 2015 revenue are registered in 40 Russian regions (Picture 5).
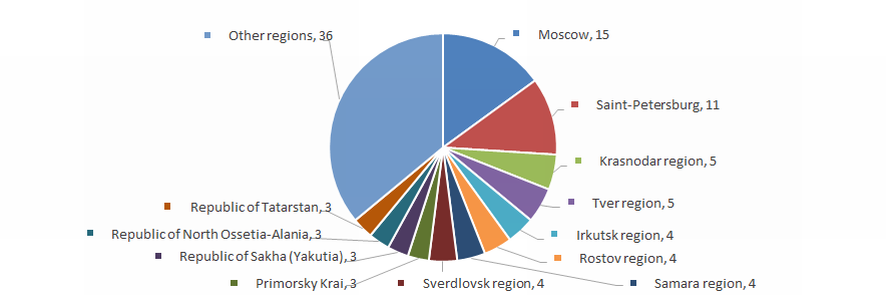 Picture 6. Distribution across the country of 100 largest Russian largest Russian retailers of household appliances