
Order a report
Custom-made industry research, company ratings, competitor analysis


Grey economy falls down
In 2020 – 2021, the volume of shady money transactions has been significantly reduced. In 2020, there was recorded a 26% decrease in such kind of transactions in the banking sector.
Cash-out transactions and withdrawal of foreign currency overseas account for the largest part of shadow schemes.
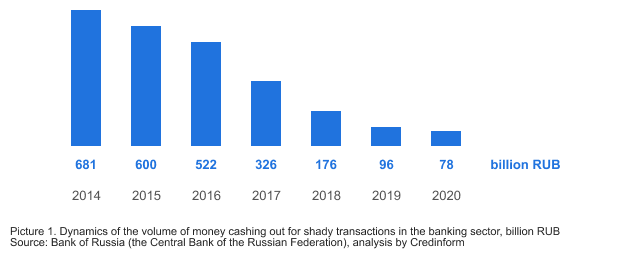
Cash-out transactions
In 2020, the amount of shady transactions for money cashing out amounted to 78 billion RUB, including the issuance of funds to individuals - 59 billion RUB, to legal entities - 16 billion RUB and individual entrepreneurs - 3 billion RUB.
Over the history of the Bank of Russia keeping statistics since 2014, the volume of cash withdrawal in the banking sector has decreased 9 times (see Picture 1).
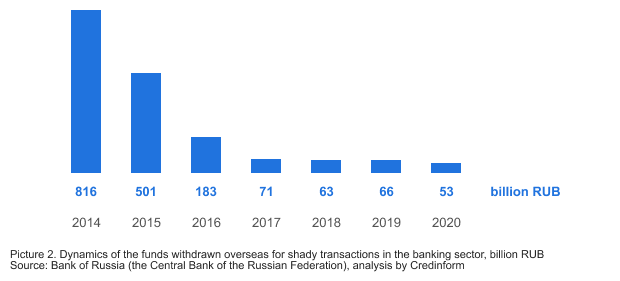
Withdrawal of funds overseas
In 2020, the volume of funds withdrawn overseas under the shady schemes amounted to 53 billion RUB. In the structure of such transactions, the majority or 24 billion RUB (45%) comes from advance payments for imported goods. In addition, funds are withdrawn through payment for the import of goods from the countries of the customs union - 10 billion RUB; transfers under transactions with services - 10 billion RUB, transfers under transactions with securities - 4 billion RUB, transfers under other schemes - 5 billion RUB.
From 2014 to 2020, the volume of funds withdrawn overseas as shady transactions decreased 15 times (see Picture 2).
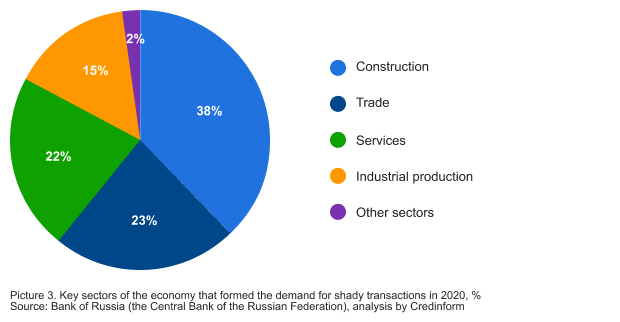
Sectors of economy with the highest volume of shady money transactions
The main demand for shady financial services is coming from the construction sector - 38%, trade - 23% and the service sector - 22% (see Picture 3).
The fight against shady money transactions is taken to a new level
Since 2014, the total volume of shady money transactions for cashing out funds and withdrawing foreign currency overseas has decreased 11 times: from 1,497 billion RUB in 2014 to 131 billion RUB in 2020.
In 2020, the Bank of Russia detected and minimized the withdrawal of funds overseas through international transport channels, advertising services, and securities turnover. The volume of withdrawal of funds on multiple assignments of debt between participants in foreign economic activity has decreased.
Despite the success of the fight against the already known schemes, new illegal methods appear. In particular, signs of illegal cashing out of funds using writs of execution for fictitious debts were detected. Especially often notaries are involved, whose orders on the compulsory recovery of funds from the debtor allow to bypass court procedures. In 2020, the volume of cashing out funds under this scheme increased by more than 60% compared to 2019, and reached 25 billion RUB.
In the second half of 2021, the Central Bank of the Russia plans to launch “Know Your Client” platform for banks - a system for providing information on the level of risk of potential and existing customers being involved in shady transactions. The verification will reduce the costs of banks, as well as the number of unreasonable refusals to open and maintain accounts.
| Avoiding suspicions of shady transactions, fines and other consequences is possible only by complying with currency control legislation and AML / CFT (Anti-Money Laundering/Combating the Financing of Terrorism) requirements under the 115-FL. A significant part of the work on AML / CFT within the framework of the corporate checking regulations is performed by the new Globas tool - Reports. Reports tool will help identify the company, check it against the special lists of the Federal Service for Financial Monitoring (Rosfinmonitoring) and the Federal Tax Service, identify beneficial owners, conflicts of interest, affiliation, find facts of violation of the law, and much more. |