TOP-1000 of companies of Kaliningrad region
In order to reduce interregional differences in the level and quality of life of the population, to accelerate the rates of economic growth and technological development, as well as to ensure the national security of the country, the Government of the Russian Federation in February 2019 approved the Strategy for the Spatial Development of Russia until 2025, comprising 12 macro regions. One of them is the Kaliningrad economic region, which includes Kaliningrad region.
Information agency Credinform has prepared a review of trends of the largest companies in Kaliningrad region.
The largest companies (TOP-1000) of the real sector of economy in terms of annual revenue were selected for the analysis according to the data from the Statistical Register and the Federal Tax Service for the latest available periods (2014-2019). The analysis was based on the data of the Information and Analytical system Globas.
Net assets are total assets less total liabilities. This indicator reflects the real value of the property of an enterprise. When the company’s debt exceeds the value of its property, the indicator is considered negative (insufficiency of property).
The largest company in term of net assets is LLC LUKOIL-KALININGRADMORNEFT, INN 3900004998. In 2019, net assets of the organization exceeded 23 billion RUB.
The lowest net assets value among TOP-1000 belonged to JSC BALT NAFTA, INN 3913007474. In 2019, insufficiency of property of the organization was indicated in negative value of -2 billion RUB.
Covering the six-year period, the average net assets values have a trend to increase with the decreasing growth rate (Picture 1).
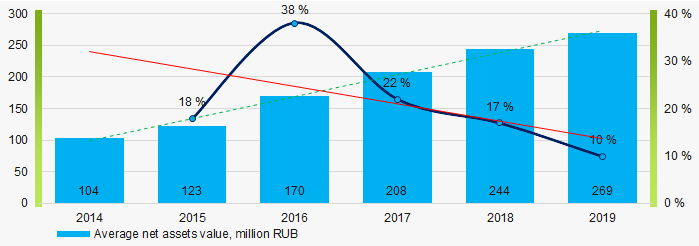 Picture 1. Change in industry average net assets value in 2014 – 2019
Over the past six years, the share of companies with insufficient property had a trend to decrease (Picture 2).
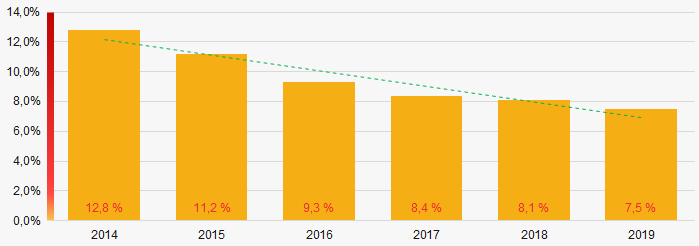 Picture 2. Shares of TOP-1000 companies with negative net assets value
 Sales revenue
In 2019, the revenue volume of 10 largest companies of the industry was 55% of total TOP-1000 revenue (Picture 3). This is indicative of high level of aggregation of capital.
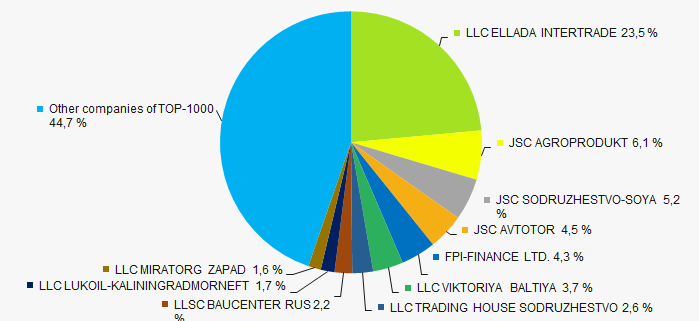 Picture 3. The share of TOP-10 companies in total 2019 revenue of TOP-1000
In general, there is a trend to increase in revenue with increasing growth rate (Picture 4).
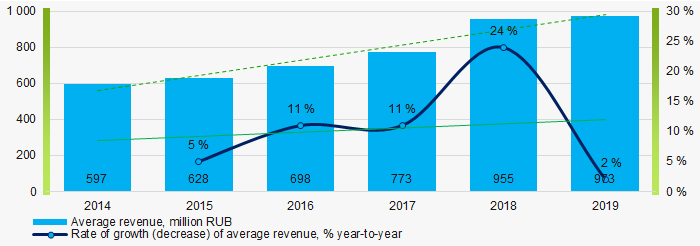 Picture 4. Change in industry average net profit in 2014 – 2019
Profit and loss
The largest organization in term of net profit is JSC AGROPRODUKT, INN 3913501820. The company’s profit for 2019 exceeded 3 billion RUB.
Covering the six-year period, there is a trend to increase in average net profit with the decreasing growth rate (Picture 5).
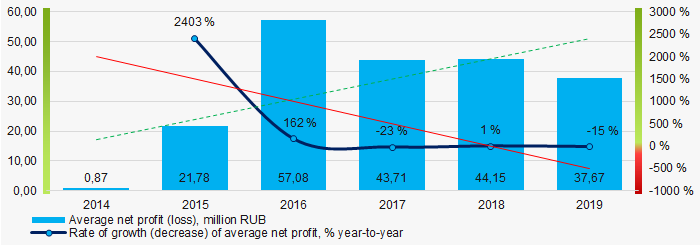 Picture 5. Change in industry average net profit (loss) values in 2014 – 2019
Covering the six-year period, the average net profit values of TOP-1000 have the increasing trend with the decreasing net loss (Picture 6).
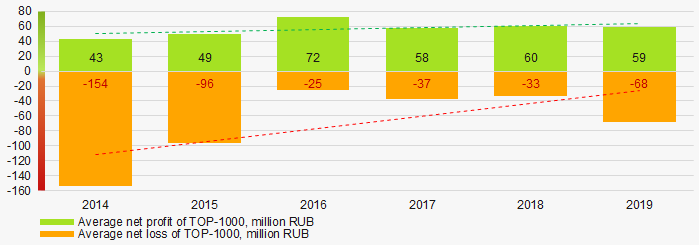 Picture 6. Change in average net profit and net loss of ТОP-1000 in 2014 – 2019
Key financial ratios
Covering the six-year period, the average values of the current liquidity ratio were significantly above the recommended one - from 1,0 to 2,0 with a trend to increase (Picture 7).
Current liquidity ratio (current assets to short-term liabilities) shows the sufficiency of company’s assets to repay on short-term liabilities.
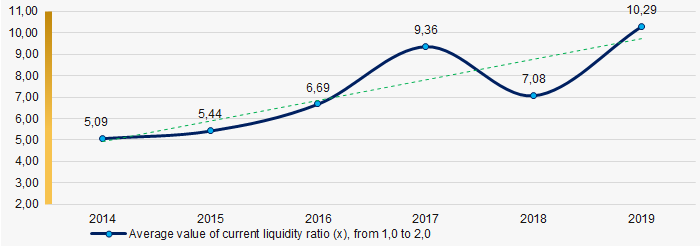 Picture 7. Изменение средних значений коэффициента общей ликвидности компаний ТОП-1000 в 2014 – 2019 годах
Covering the six-year period, the average values of ROI ratio have a trend to decrease (Picture 8).
ROI ratio is calculated as net profit to sum of shareholders equity and long-term liabilities, and shows the return of equity involved in commercial activities and long-term borrowed funds.
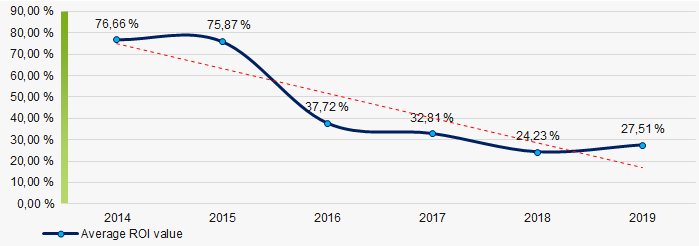 Picture 8. Change in industry average values of ROI ratio in 2014 – 2019
Assets turnover ratio is the ratio of sales revenue and company’s average total assets for a period. It characterizes the effectiveness of using of all available resources, regardless the source of their attraction. The ratio shows how many times per year the full cycle of production and circulation is performed, generating the corresponding effect in the form of profit.
Covering the six-year period, business activity ratio demonstrated the decreasing trend (Picture 9).
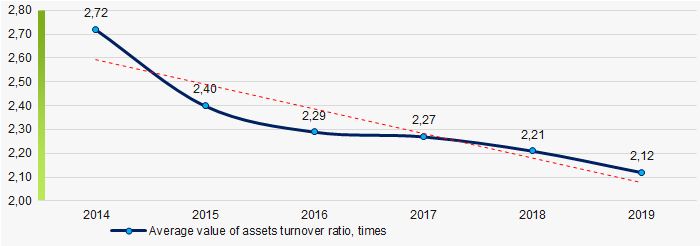 Picture 9. Change in average values of assets turnover ratio in 2014 – 2019
Small business
79% of TOP-1000 organizations are registered in the Register of small and medium-sized enterprises of the Federal Tax Service of the Russian Federation. Their share in total revenue of TOP-1000 is 16% that is almost twice as low as the national average in 2018-2019 (Picture 10).
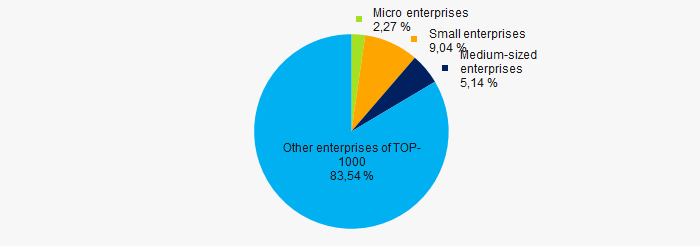 Picture 10. Shares of revenue of small and medium-sized enterprises in TOP-1000
Financial position score
Assessment of the financial position of TOP-1000 companies shows that the majority of them have financial position above average (Picture 11).
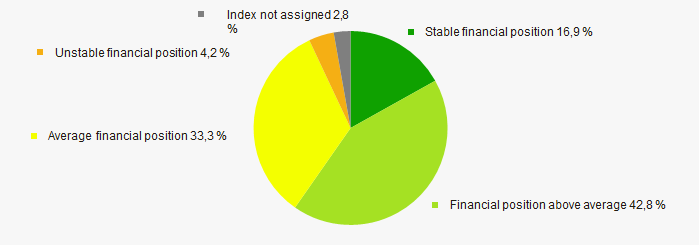 Picture 11. Distribution of TOP-1000 companies by financial position score
Solvency index Globas
Most of TOP-1000 companies got Superior / High and Strong / Medium index Globas. This fact shows their ability to meet their obligations fully (Picture 12).
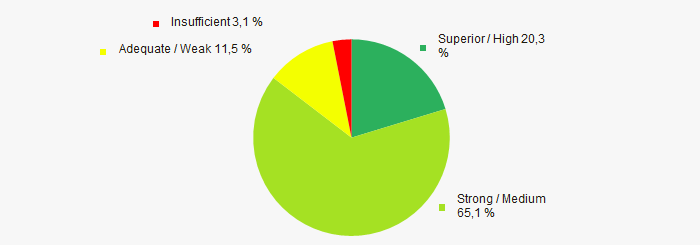 Picture 12. Distribution of TOP-1000 companies by solvency index Globas
Index of industrial production
According to the Federal State Statistics Service, the increasing trend in the industrial production index was recorded for the Kaliningrad economic region during the 12 months of 2019 - 2020 (Picture 13). At the same time, the average indicator of the index month to month of the previous year was 92%.
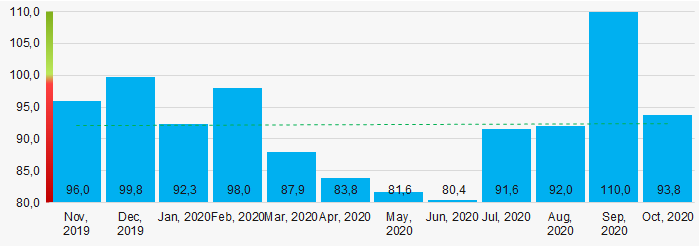 Picture 13. Average index of industrial production in the Kaliningrad economic region in 2019 - 2020, month to month of the previous year (%)
Conclusion
Complex assessment of activity of the largest companies of the real sector of economy in the Kaliningrad economic region, taking into account the main indexes, financial ratios and indicators, demonstrates the prevalence of positive trends (Table 1).
| Trends and evaluation factors | Relative share of factors, % |
| Dynamics of the average net assets value |  10 10 |
| Rate of growth (decrease) in the average size of net assets |  -10 -10 |
| Increase (decrease) in the share of enterprises with negative values of net assets |  10 10 |
| Level of competition / monopolization |  -5 -5 |
| Dynamics of the average revenue |  10 10 |
| Rate of growth (decrease) in the average size of revenue |  10 10 |
| Dynamics of the average profit (loss) |  10 10 |
| Dynamics of the average profit (loss) |  -10 -10 |
| Growth / decline in average values of companies’ net profit |  10 10 |
| Growth / decline in average values of companies’ net loss |  10 10 |
| Increase / decrease in average values of total liquidity ratio |  5 5 |
| Increase / decrease in average values of return on investment ratio |  10 10 |
| Increase / decrease in average values of asset turnover ratio, times |  -10 -10 |
| Share of small and medium-sized businesses in terms of revenue being more than 20% |  -10 -10 |
| Financial position (the largest share) |  10 10 |
| Solvency index Globas (the largest share) |  10 10 |
| Index of industrial production |  -5 -5 |
| Average value of relative share of factors |  3,2 3,2 |
 positive trend (factor),
  negative trend (factor).
Legislation amendments
Changes to the Article 5 of the Federal Law «On state registration of legal entities and individual entrepreneurs» were made by the Federal Law No. 350-FZ dated 27.10.2020. The amendments clarified the content of the Unified State Register of Legal Entities (EGRUL). In particular, the registry must contain the following data concerning limited liability companies:
- amount and nominal value of equity stake owned by each shareholder,
- pledging of a share or its part or data on other charges,
- transfer of a share or its part (including shares transferring by succession order) to trust management and data on trustee,
In regards to joint stock companies:
- information that the company has a single shareholder, and information about such shareholder,
- data on share registrar.
Some data on legal entities and individual entrepreneurs will be entered in EGRUL by registration authorities. Such information includes:
- legal form;
- indication of the status of an international company;
- form of legal entity incorporation (incorporation or reorganization);
- data on succession – for legal entities incorporated as a result of reorganization of other legal entities, constituent documents of which are amended due to the reorganization, as well as for legal entities that have ceased their activities as a result of the reorganization;
- form of legal entity termination;
- data on process of winding-up or reorganization;
- date of state registration of a natural person as an individual entrepreneur;
- date and form of termination of an entrepreneurship.
Besides, the period for notification of registration authorities by legal entities and individual entrepreneurs on changes in EGRUL has been extended from three to seven working days. The Law will come into force on April 24, 2021.