
Order a report
Custom-made industry research, company ratings, competitor analysis


Industry trends Air transportation
Information agency Credinform presents a review of air transportation industry trends.
Air transportation enterprises with the highest volume of annual revenue (TOP-10 and TOP-500) have been selected for the ranking, according to the data from the Statistical Register for the latest available accounting periods (2015 and 2016). The analysis was based on the data from the Information and Analytical system Globas.
Legal forms
Limited liability company is the prevailing legal form among air transportation companies. Non-public joint stock companies’ fraction is significant too (Picture 1).
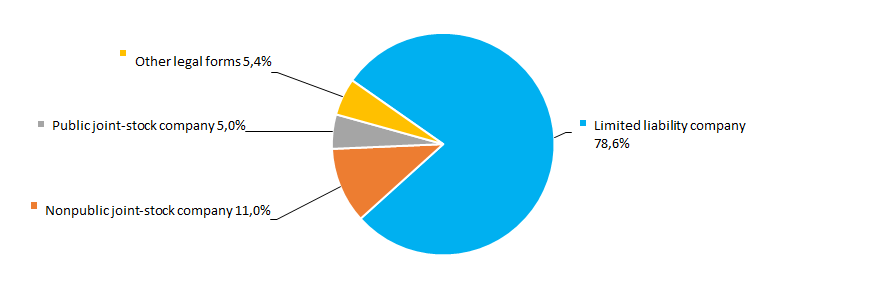 Picture 1. TOP-500 companies by legal forms
Sales revenue
In 2016 sales revenue of 10 industry leaders amounted to 78% of total revenue of TOP-500 companies. This points to a high degree of monopolization within the industry. PJSC Aeroflot-Russian Airlines is the largest company in 2016 by revenue (Picture 2).
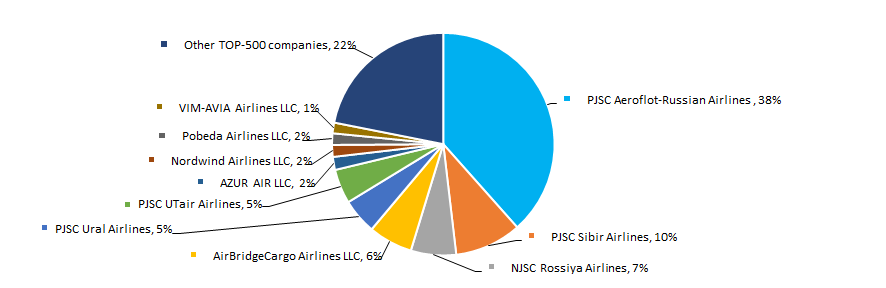 Picture 2. TOP-10 companies by their share in 2016 total revenue of TOP-500 companies, %
2011 witnessed the best revenue results in the decade. Crisis periods in economy of 2012, 2013 and 2016 resulted in decrease in industry average values (Picture 3).
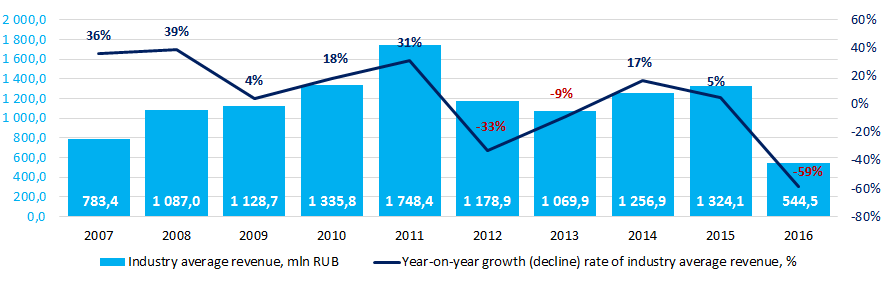 Picture 3. Change in industry average revenue of air transportation companies in 2007 – 2016
Profit and loss
In 2016 profit of 10 industry leaders amounted to 90% of total profit of TOP-500 companies. PJSC Aeroflot-Russian Airlines is also the leading company by profit in 2016 (Picture 4).
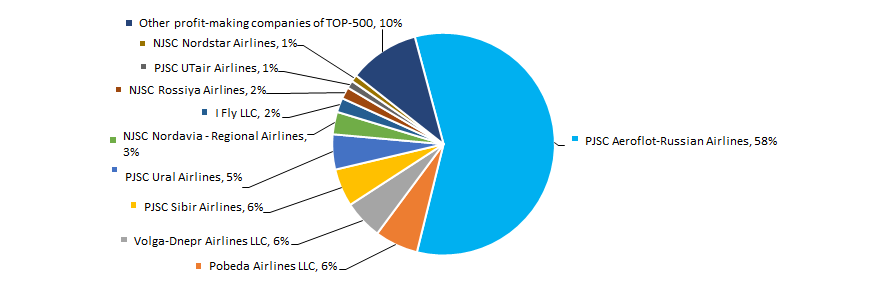 Picture 4. TOP-10 companies by their share in 2016 total profit of TOP-500 companies, %
Profit values of the air transportation industry are not stable within the decade. There was a decline in profit in 2007 – 2009, 2011 – 2012 and in 2014 against the backdrop of economic downturn. The industry has performed its best in 2010 (Picture 5).
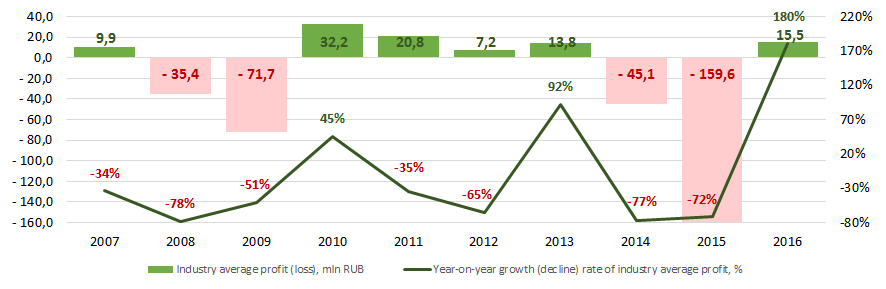 Picture 5. Change in industry average profit of air transportation companies in 2007 – 2016
There were 136 loss-making enterprises among TOP-500 companies in 2015. In 2016 the number increased to 143 or by 5%. Moreover, their average loss decreased by 88%. As for other TOP-500 companies, their average profit was 5 times higher for the same period (Picture 6).
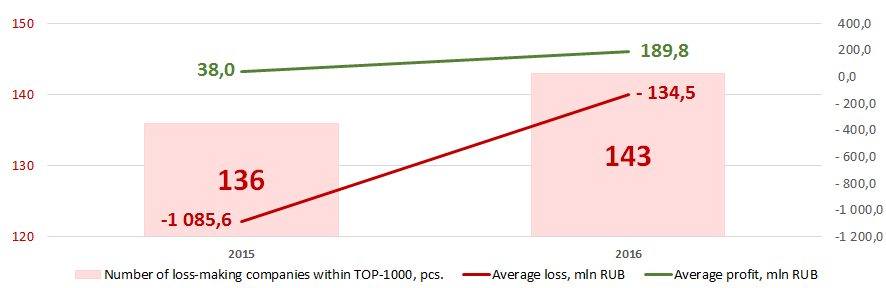 Picture 6. Number of loss-making companies, average values of loss and profit of TOP-500 companies in 2015 – 2016
Equity
At year-end 2016 PJSC Aeroflot-Russian Airlines had the largest equity among TOP-500 companies. PJSC Transaero Airlines that is under liquidation procedure since October 6, 2017 had the worst equity condition (Table 1).
| No. | Name | Name | |
| 2015 | 2016* | ||
| 1. | PJSC Aeroflot-Russian Airlines | 49,34 | 79,96 |
| 2. | GazpromAvia Aviation Company LLC | 26,44 | 28,94 |
| 3. | Volga-Dnepr Airlines LLC | 9,27 | 12,26 |
| 4. | PJSC Aurora Airlines | 4,37 | 8,49 |
| 5. | PJSC Sibir Airlines | 4,16 | 5,63 |
| 6. | PJSC Aviation Company Ural Airlines | 1,93 | 4,75 |
| 7. | Pobeda Airlines LLC | 9,65 | 4,30 |
| 8. | PJSC Yamal Aviation Transportation Company | 3,94 | 3,95 |
| 9. | AVIASERVICE LLC | 3,14 | 3,41 |
| 10. | AirBridgeCargo Airlines LLC | 2,87 | 1,80 |
| 491. | PJSC DONAVIA | 0,38 | -0,49 |
| 492. | Art Avia LLC | -0,29 | -0,80 |
| 493. | Tomsk Avia Airlines LLC | -0,79 | -1,40 |
| 494. | NJSC Red WingsС | -1,71 | -1,91 |
| 495. | NJSC AEROCOM Company | -1,99 | -2,03 |
| 496. | NJSC Polet Airlines | -2,67 | -2,78 |
| 497. | NJSC NORDAVIA – Regional Airlines | -12,55 | -10,82 |
| 498. | PJSC UTair Airlines | -12,83 | -11,69 |
| 499. | PJSC Orenburg Airlines | -7,55 | -15,75 |
| 500. | PJSC Aviation company Transaero | -97,95 | -104,84 |
*) Companies with positive trends in 2016 as compared to prior year are highlighted green in Table 1, the ones with negative trends are highlighted red.
Key financial ratios
During the decade industry average values of liquidity coverage ratio were declining gradually and in the last 3 years they were below the recommended values – from 1,0 to 2,0 (Picture 7).
Liquidity coverage ratio (a ratio of current assets to current liabilities) reveals the sufficiency of a company’s funds for meeting its liabilities.
Solvency ratio (a ratio of shareholders’ equity to total assets) shows the dependence of the company on external loans. Its recommended value: >0,5. A value less than a minimum one is indicative of a strong dependence on external sources of funds.
A calculation of practical values of financial ratios, which might be considered as normal for a certain industry, has been developed and implemented in the Information and Analytical system Globas-i by the experts of Information Agency Credinform www.credinform.ru/en-US, having taken into account the current situation in the economy as a whole and in the industries. The practical value of solvency ratio for air transportation companies is from 0,02 to 0,87.
During the decade industry average values were within practical values, excluding 2015 that showed a negative value (Picture 7).
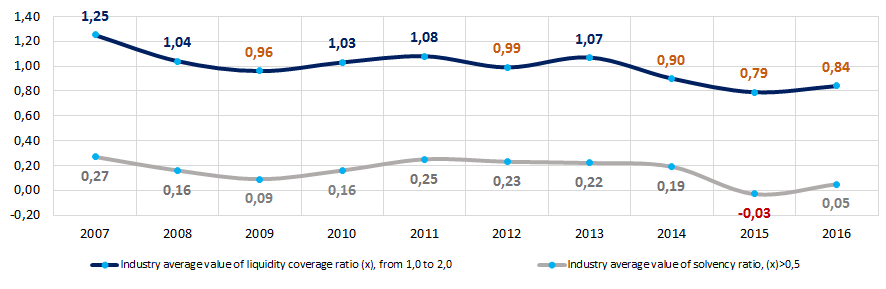 Picture 7. Change in industry average values of liquidity coverage ratio and solvency ratio of air transportation companies in 2007 – 2016
The return on investment ratio was not stable during the decade. Ratio values became negative during economic downturn (in 2008, 2014, 2015), (Picture 8). It is a ratio of net profit to shareholders’ equity and noncurrent liabilities, and it demonstrates benefit from shareholders’ equity engaged in business activity and long-term raised funds of the company.
There is a similar trend in cost to revenue ratio (Picture 8). A 2015 skyrocketing growth might be caused by the exit from the market of one of the largest airlines in the country - PJSC Transaero Airlines. The ratio is calculated as a ratio of sales profit to operation costs. In general, it reflects production efficiency.
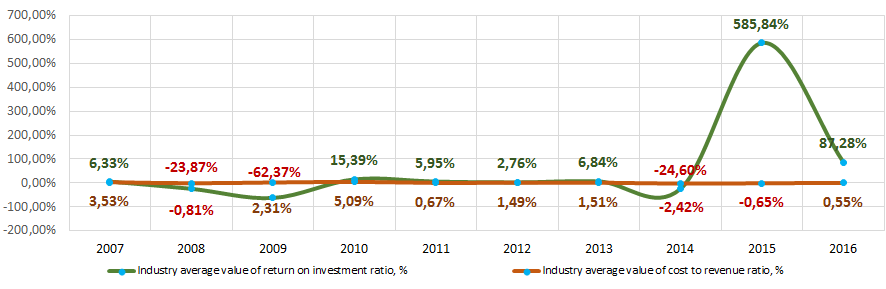 Picture 8. Change in industry average values of return on investment ratio and cost to revenue ratio of air transportation companies in 2007 – 2016
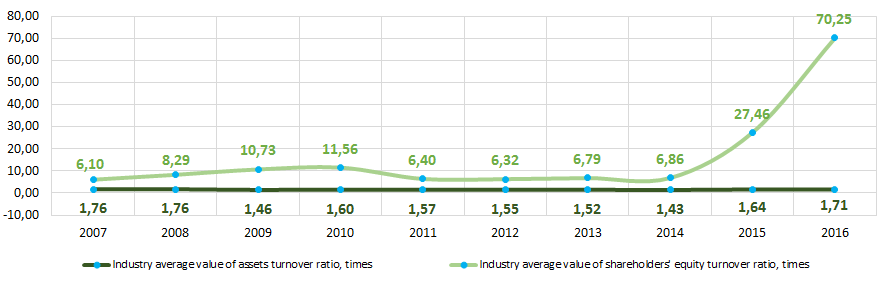
Assets turnover ratio is relatively stable within the decade (Picture 9).
Assets turnover ratio is a ratio of sales revenue to average total assets for the period, and measures resource efficiency regardless of the sources. The ratio indicates the number of profit-bearing complete production and distribution cycles per annum.
Shareholders’ equity turnover ratio is a ratio of revenue to annual average shareholders’ equity, and indicates total assets usage rate.
There is a considerable increase in the ratio values in 2015 – 2016 (Picture 9).
 Picture 9. Change in industry average values of activity ratios of air transportation companies in 2007 – 2016
Structure of services
The most of TOP-500 companies specialize in passenger-carriage operations (Picture 10).
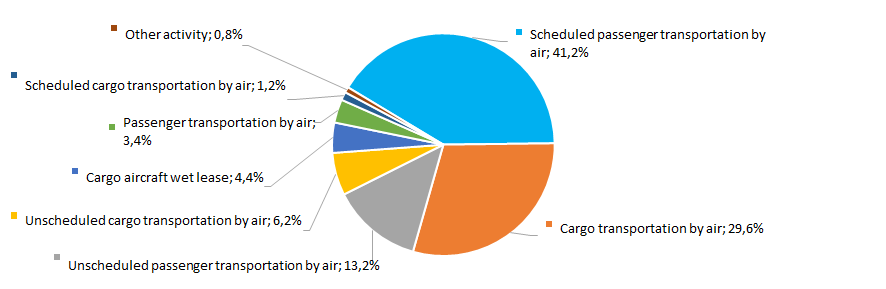 Picture 10. TOP-500 companies by types of services, %
Business activity trends
There is a diversity in distribution of registered TOP-500 companies by the year of their foundation within a 25-year period. The most of air transportation companies were founded in 2012 - 2015 (Picture 11).
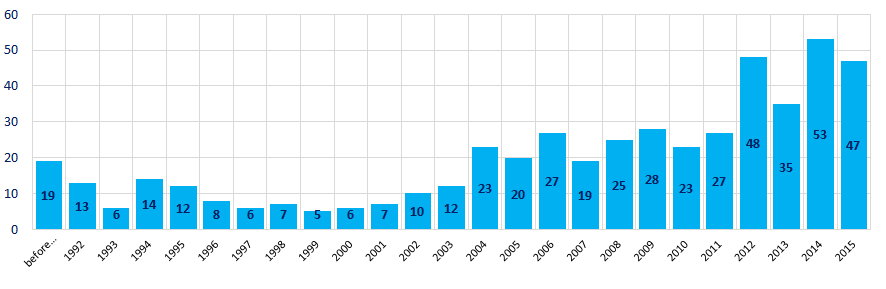 Picture 11. ТOP-500 companies by the year of foundation
Private sector has shown the strongest interest to air transportation after 2010 when there were registered 37 new companies on average per year (Picture 12).
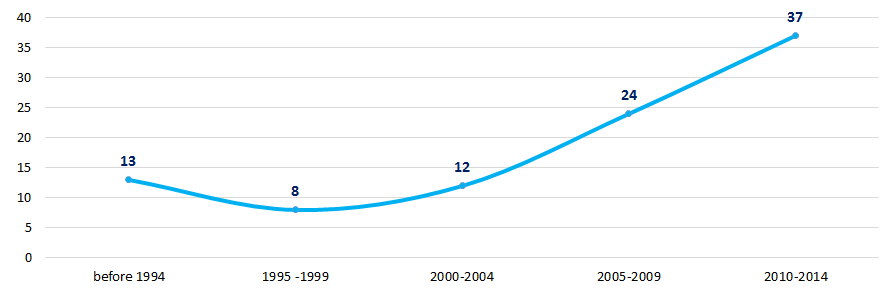 Picture 12. Average number of TOP-500 companies registered per year by their foundation periods
Key home regions
Air transportation companies are unevenly distributed throughout Russian territory. Most of them are registered in Moscow, the largest financial center of the country with an extensive transportation infrastructure (Picture 13). TOP-500 companies are registered in 71 region of Russia.
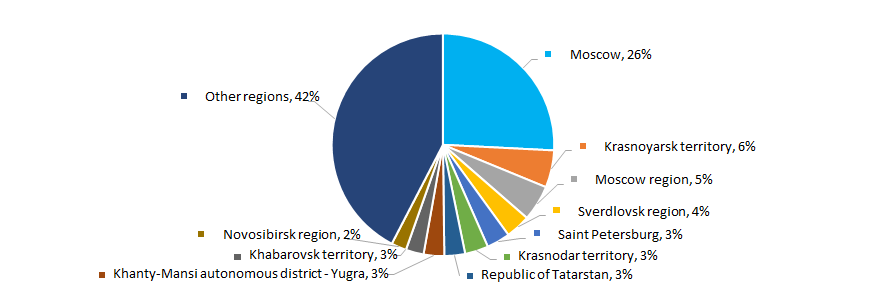 Picture 13. TOP-500 companies by Russian regions
The most of air transportation companies are accumulated in the Central federal district (Picture 14).
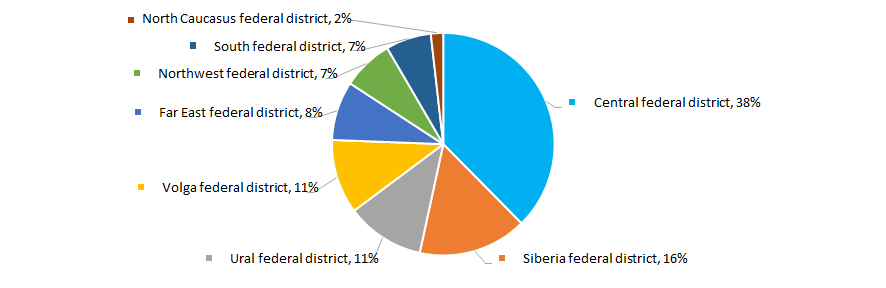 Picture 14. TOP-500 companies by federal districts of Russia
11% of TOP-500 companies have branches and representative offices.
Arbitration proceedings
Most companies do not participate in arbitration proceedings. Active participants of arbitration hearings comprise a significant share, and this may be caused by the nature of transportation services (Picture 15).
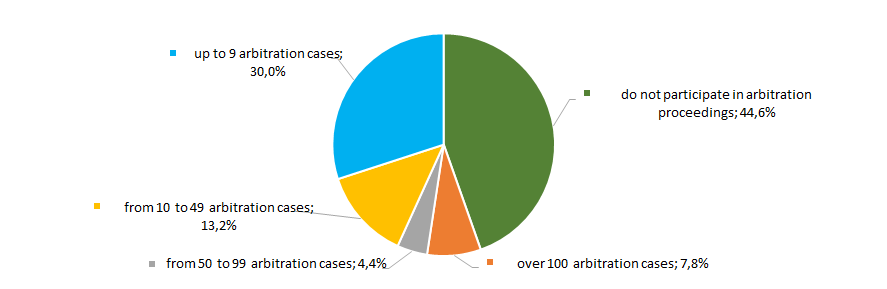 Picture 15. TOP-500 companies by their participation in arbitration proceedings, %
Reliability index
The risk of meeting a fly-by-night company or an unreliable company is extremely low within the most companies of the sector (Picture 16).
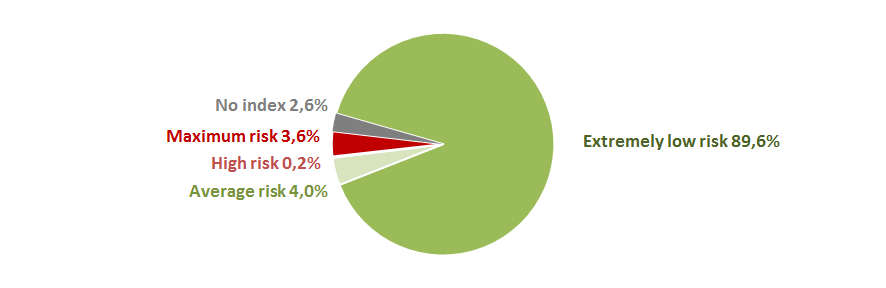 Picture 16. TOP-500 companies by Reliability index, %
Final position score
Assessment of financial state of the sector’s companies indicates that the most of the companies have an average financial standing. However, there is a significant share (28%) of companies that have an unstable or critical standing (Picture 17).
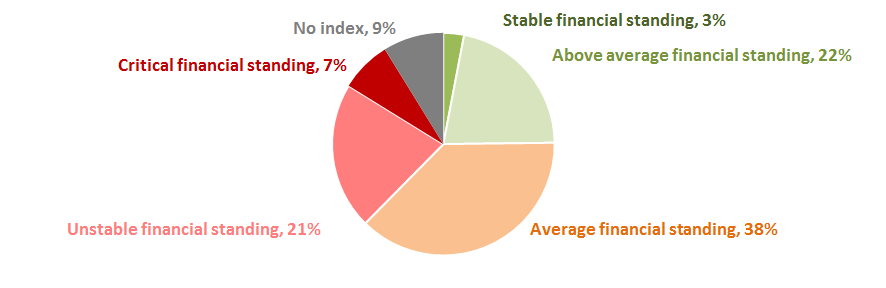 Picture 17. TOP-500 companies by Final position score, %
Liquidity index
There is a minimal or insignificant risk of bankruptcy in the short term for the most companies of the sector (36%). However, a significant part of 23% of companies have maximum risks of going bankrupt (Picture 18).
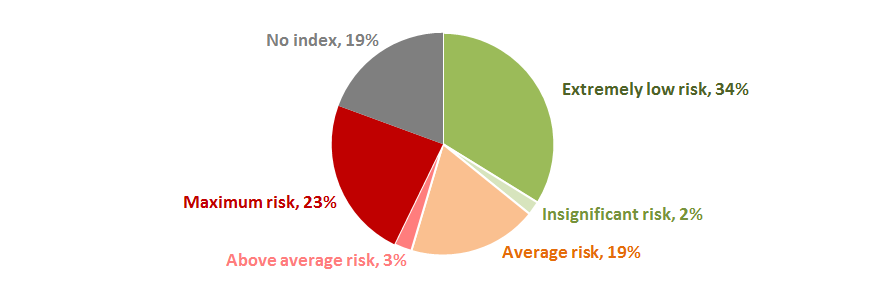 Picture 18. TOP-500 companies by Liquidity index, %
53% of TOP-500 air transportation companies have got an adequate, weak, unsatisfactory, poor or insufficient Solvency index Globas (Picture 19).
Together with key indexes, financial figures and ratios, this may speak of adverse trends within the industry.
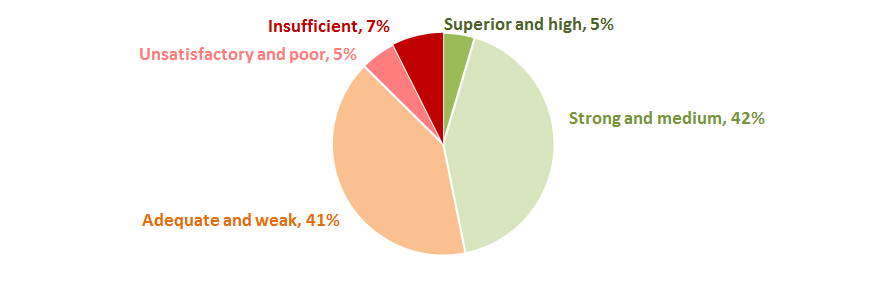 Picture 19. TOP-500 companies by Solvency index Globas