TOP-1000 companies of the Central Black Earth Region of Russia
In order to reduce interregional differences in the level and quality of life of people, the Ministry of Economic Development of the RF approved the strategy of spatial development of Russia in February 2019. 12 macro-regions were formed in the strategy. One of them is the Central Black Earth Region, which includes: Belgorod, Voronezh, Kursk, Lipetsk and Tambov regions.
Information agency Credinform represents an overview of activity trends of the largest enterprises of the real sector of the economy in the Central Black Earth economic region of Russia.
Enterprises with the largest volume of annual revenue (TOP-1000) were selected for the analysis, according to the data from the Statistical Register for the latest available periods (for 2013 - 2018). The analysis was made on the basis of the data of the Information and Analytical system Globas.
Net assets value is an indicator, reflecting the real value of company’s property, is calculated annually as the difference between assets on the enterprise balance and its debt obligations. The indicator of net assets is considered negative (insufficiency of property), if company’s debt exceeds the value of its property.
The largest enterprise of the Central Black Earth economic region of Russia in terms of net assets is NOVOLIPETSK STEEL MILL PJSC, INN 4823006703, Lipetsk region. Its net assets amounted to 336,1 billion rubles in 2018.
The smallest amount of net assets in the TOP-1000 list was hold by METALL-GROUP LLC, is in the process of being wound up since 22.03.2018, INN 7811122323, Belgorod region. The insufficiency of property of this company in 2018 was expressed as a negative value of -10,6 billion rubles.
The average values of net assets of TOP-1000 enterprises tend to increase over the five-year period (Picture 1).
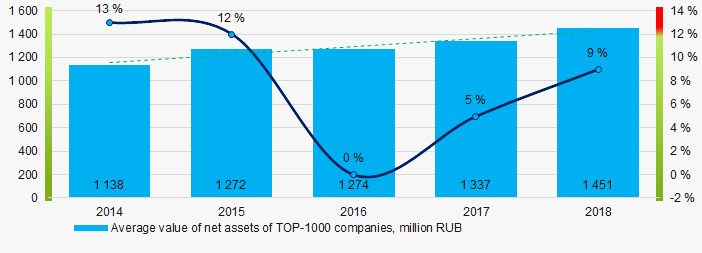 Picture 1. Change in the average indicators of the net asset value of TOP-1000 companies in 2014 – 2018
The shares of TOP-1000 enterprises with insufficiency of assets have a tendency to decrease in the last five years (Picture 2).
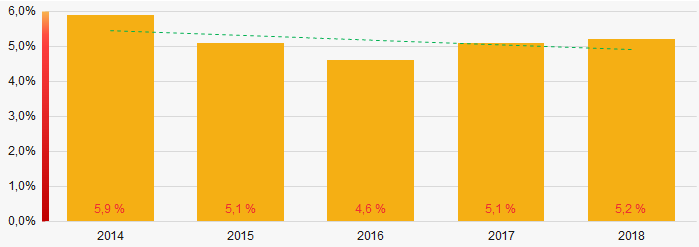 Picture 2. Shares of enterprises with negative values of net assets in TOP-1000
Sales revenue
The revenue volume of 10 leading companies of the region made 31,3% of the total revenue of TOP-1000 in 2018 (Picture 3). It points to a relatively high level of capital concentration.
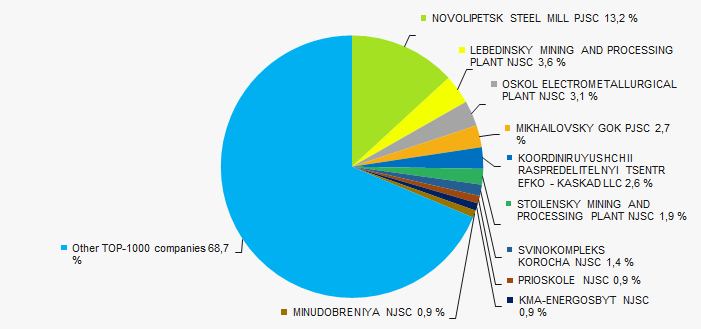 Picture 3. . Shares of participation of TOP-10 companies in the total revenue of TOP-1000 enterprises for 2018
 In general, there is a tendency to increase in the revenue volumes (Picture 4).
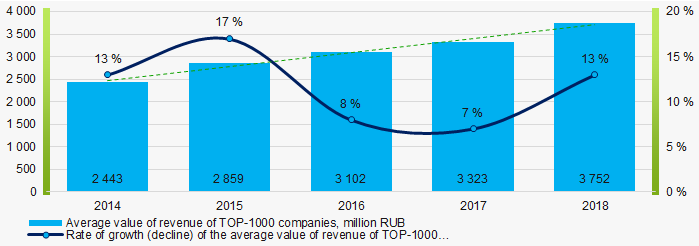 Picture 4. Change in the average revenue of TOP-1000 companies in 2014 – 2018
 Profit and losses
The largest company in terms of net profit value is also NOVOLIPETSK STEEL MILL PJSC, INN 4823006703, Lipetsk region. Company's profit amounted to 117,9 billion rubles in 2018.
Over a five-year period, TOP-1000 enterprises showed a tendency to growth of profits (Picture 5).
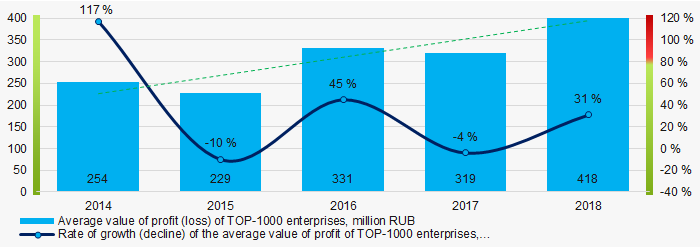 Picture 5. Change in the average indicators of profit of TOP-1000 companies in 2014 – 2018
Average values of net profit’s indicators of TOP-1000 enterprises have a tendency increase over a five-year period, at the same time the average value of net loss decreases. (Picture 6).
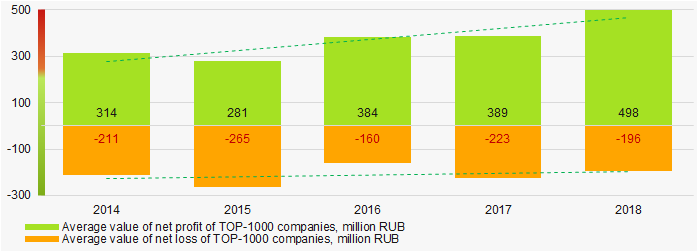 Picture 6. Change in the average indicators of net profit and net loss of TOP-1000 companies in 2014 – 2018
 Key financial ratios
Over the five-year period, the average indicators of the total liquidity of TOP-1000 enterprises were above the range of recommended values - from 1,0 up to 2,0, with a tendency to increase (Picture 7).
The total liquidity ratio (the relation of the amount of current assets to short-term liabilities) shows the sufficiency of company’s funds for repayment of its short-term liabilities.
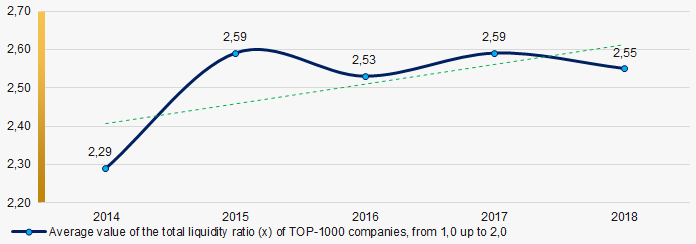 Picture 7. Change in the average values of the total liquidity ratio of TOP-1000 companies in 2014 – 2018
 Over the course of three years out of five years, there is a high level of average indicators of return on investment ratio, with a tendency to decrease (Picture 8).
The ratio is calculated as the relation of net profit to the sum of own capital and long-term liabilities and demonstrates the return on the equity involved in the commercial activity and the long-term borrowed funds of an organization.
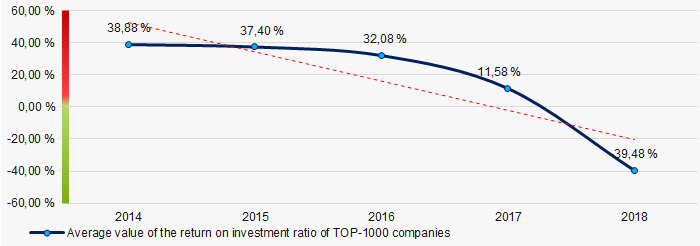 Picture 8. Change in the average values of the return on investment ratio of TOP-1000 companies in 2014 – 2018
 Asset turnover ratio is calculated as the relation of sales proceeds to the average value of total assets for a period and characterizes the efficiency of use of all available resources, regardless of the sources of their attraction. The ratio shows how many times a year a complete cycle of production and circulation is made, yielding profit.
Over a five-year period, this indicator of business activity showed a tendency to decrease (Picture 9).
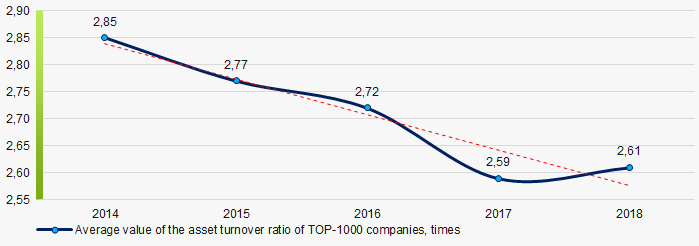 Picture 9. Change in the average values of the asset turnover ratio of TOP-1000 companies in 2014 – 2018
Small business
38% enterprises from TOP-1000 are registered in the Register of small and medium-sized enterprises of the Federal Tax Service of the RF. At the same time, their share in the total revenue of TOP-1000 amounts only to 9,1%, that is significantly lower than the national average (Picture 10).
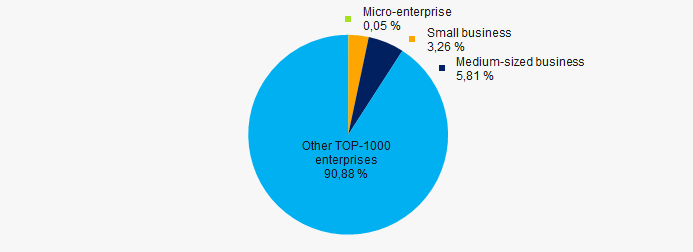 Picture 10. Shares of proceeds of small and medium-sized enterprises in TOP-1000 companies
Main regions of activity
TOP-1000 companies are registered in all 5 regions and distributed unequal across the territory. Almost 58% of the largest enterprises in terms of revenue are concentrated in Belgorod and Lipetsk regions (Picture 11).
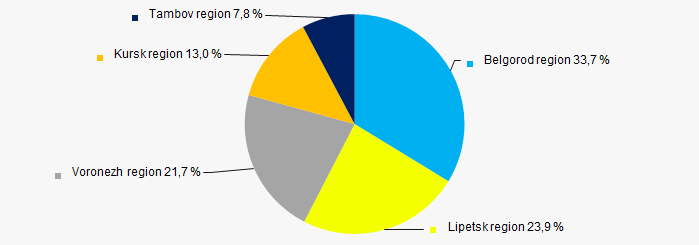 Picture 11. Distribution of the revenue of TOP-1000 companies by regions of the Central Black Earth economic region of Russia
Financial position score
An assessment of the financial position of TOP-1000 companies shows that the financial position of the most of them is above average (Picture 12).
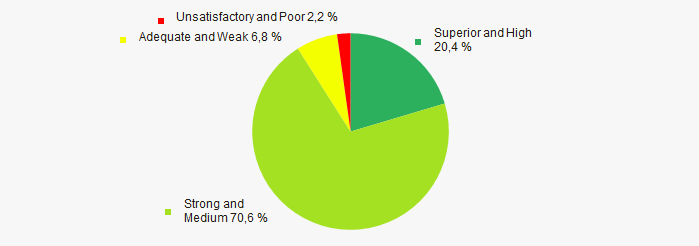 Picture 12. Distribution of TOP-1000 companies by financial position score
Solvency index Globas
The vast majority of TOP-1000 enterprises got Superior/High or Strong/Medium Solvency index Globas, that points to their ability to pay off their debts in time and fully (Picture 13).
 Picture 13. Distribution of TOP-50 companies by solvency index Globas
Industrial production index
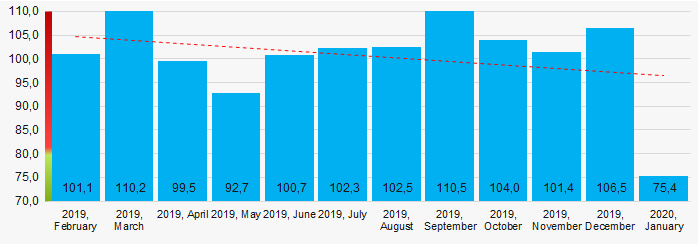
According to the Federal State Statistics Service, there is a tendency towards a decrease in indicators of the industrial production index in the Central Black Earth economic region of Russia during 12 months of 2019 – 2020 (Picture 14). At the same time, the average index month-over-month made 100,6%.
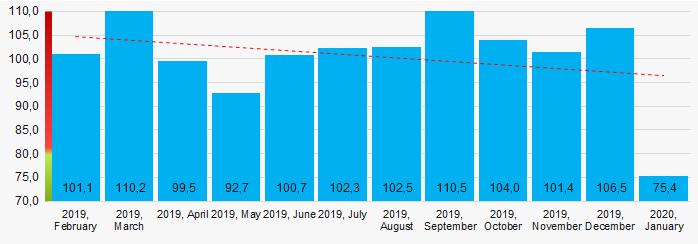 Picture 14. Averaged industrial production index in regions of the Central Black Earth economic region of Russia in 2019 - 2020, month-over-month (%)
According to the same data, the share of enterprises of the Central Black Earth economic region of Russia in the total amount of revenue from the sale of goods, works, services made 2,577%, countrywide for 2018, and for 9 months of 2019 – 2,528%, that is lower than the indicator for the same period of 2018, which amounted to 2,587%.
Conclusion
A comprehensive assessment of activity of the largest enterprises of the real sector of the economy in the Central economic region of Russia, taking into account the main indices, financial indicators and ratios, points to the prevalence of positive trends (Table 1).
| Trends and evaluation factors of TOP-1000 | Specific share of factor, % |
| Rate of growth (decline) in the average size of net assets |  10 10 |
| Increase / decrease in the share of enterprises with negative values of net assets |  10 10 |
| Level of competition / monopolization |  5 5 |
| Rate of growth (decline) in the average size of revenue |  10 10 |
| Rate of growth (decline) in the average size of profit (loss) |  10 10 |
| Growth / decline in average values of net profit of companies |  10 10 |
| Growth / decline in average values of net loss of companies |  10 10 |
| Increase / decrease in average values of total liquidity ratio |  5 5 |
| Increase / decrease in average values of return on investment ratio |  -10 -10 |
| Increase / decrease in average values of asset turnover ratio, times |  -10 -10 |
| Share of small and medium-sized enterprises in the region in terms of revenue being more than 22% |  -10 -10 |
| Regional concentration |  5 5 |
| Financial position (the largest share) |  10 10 |
| Solvency index Globas (the largest share) |  10 10 |
| Industrial production index |  5 5 |
| Dynamics of the share of proceeds of the region in the total revenue of the RF |  -10 -10 |
| Average value of the specific share of factors |  3,8 3,8 |
 positive trend (factor),
  negative trend (factor).
High-rise business
Office in an expensive skyscraper supports company’s goodwill. However, is prestigious address an indicator of success and solvency of a company?
Skyscrapers around the globe
The demand on skyscraper construction is increasing every year. Since modern high-rise business district is one of the indicators of investment attractiveness of metropolis and the country, major economies and global cities are in constant race for the tallest building.
Skyscraper is a freestanding building that is taller than 150 meters. Currently, there are 49 skyscrapers in Russia: 45 in Moscow, 3 in Yekaterinburg, and 1 in Saint Petersburg. Standing 462 meters tall, the Lakhta Center is the tallest building in Europe and the 13th-tallest building in the world.
Moscow leads by the total number of skyscrapers in Europe: there are 20 skyscrapers in London, 19 in Paris including La Défense, 16 in Frankfurt am Main, 8 in Warsaw, 5 in Madrid and 5 in Rotterdam.
Having 284 skyscrapers, New York yield the global palm to Hong Kong with 355 buildings. Anytime soon, another Chinese metropolis Shenzhen with 283 skyscrapers will be ahead of the Big Apple. Dubai, Shanghai and Tokyo having 200, 163 and 157 skyscrapers respectively, are worth to be mentioned. For all the 20th century, the USA used to be a leader in high-rise construction. However, the center for the construction of high-rises moved to Asia, and the United States gradually lose the monopoly.
The number of skyscrapers indicates the investment demand in the region, as well as engineering capabilities to construct and maintain the building, which is challenging without developed industries and professional capacities. Country area and population play a small part. For example, there is only one skyscraper in oil-rich Nigeria with 200 million persons.
Moscow City is the center of high-rise construction in Russia
Moscow is a financial and economic center of Russia. Gross regional product of Moscow is four times that of the following Saint Petersburg, and Moscow is 3,2 times ahead of Saint Petersburg by capital investment. It is no surprise that construction of skyscrapers is concentrated in the capital of our country, and Moscow City (or the City) is a countrywide demonstration project and one of the symbols of modern Russia.
Several thousand companies are located in the skyscrapers of the City. The very fact of purchasing or renting office there demonstrates the counterparty’s status. From the other hand, it can hide the weaknesses of the company to be examined before the conclusion of a contract.
Table 1 contains summary analysis of all active companies registered in three tallest business centers of the City. About a half of all active companies located at the Federation Tower were established less than three years ago; 674 companies have debts to the Federal Tax Service; 487 companies have a valid record on unreliability of data in the Unified State Register of Legal Entities; 40 companies faced to bankruptcy; 23 companies have bankrupted private person as a shareholder or director; 46 firms have shell company signs. In addition, one company can have several warning indicators.
Location of a counterparty is not always indicative of its success, financial stability and solvency. Despite high rental rates, the shining skyscrapers are attractive for shell companies and persons pretending to be accomplished entrepreneurs without real business history and high turnover.
| The Federation Tower, 374 meters | The City of Capitals, 302 meters | The Empire Tower, 239 meters | |
| Address | Moscow, Presnenskaya nab., 12 | Moscow, Presnenskaya nab., 8 | Moscow, Presnenskaya nab., 6 |
| Largest companies | JSC VTB CAPITAL | JSC IC IT INVEST | LLC SNS SERVICE |
| JSC CONCERN TITAN-2 | LLC INTERMETGROUP | JSC UCC URALCHEM | |
| LLC NOVA GROUP | LLC T-SERVICE LOGISTIC | LLC DENTSU AEGIS C S | |
| Active companies, total | 2 275 | 1 005 | 592 |
| INCLUDING THOSE WITH WARNING FACTORS | |||
| Established not earlier than 3 years ago | 1 113 48,9% of total number |
375 37,3% of total number |
247 41,7% of total number |
| Minimum average number of employees up to 3 | 1 062 46,7% |
475 47,3% |
199 33,6% |
| Tax and dues debtors | 674 29,6% |
206 20,5% |
137 23,1% |
| Executive documents cannot be enforced | 552 24,3% |
166 16,5% |
126 21,3% |
| Valid record on unreliability of data in the Unified State Register of Legal Entities | 487 21,4% |
74 7,4% |
56 9,5% |
| Frequently registered address, multiple registered shareholder and/or CEO according to the Federal Tax Service | 225 9,9% |
150 14,9% |
81 13,7% |
| Shell company signs | 46 2,0% |
16 1,6% |
9 1,5% |
| Bankruptcy of a company | 40 1,8% |
24 2,4% |
10 1,7% |
| Pledges of movable property | 39 1,7% |
32 3,2% |
21 3,5% |
| Bankruptcy of a shareholder / CEO | 23 1,0% |
3 0,3% |
7 1,2% |
| Unreliable suppliers in procurement | 7 0,3% |
1 0,1% |
1 0,2% |
| Disqualification of CEO | 5 0,2% |
2 0,2% |
1 0,2% |
Predominantly Russian companies are located at the towers of Moscow City. The share of domestic business renting offices in the business complex exceeding 70%. Unlike the City of London and La Défense in Paris, there are few transnational companies in Moscow City: KPMG, IBM, General Motors, Pfizer.
Recently, significant government structures and enterprises take an active interest in business real estate of Moscow City. In 2016, JSC TRANSNEFT acquired 79 thousand square meters in the Evolution Tower, and the Moscow mayor’s office bought 55 thousand square meters in the OKO Tower. In 2017, JSC DOM.RF acquired 74 thousand square meters in the IQ-quarter for the officers of the Ministry of Industry and Trade of Russia, the Ministry of Digital Development, Communications and Mass Media of the Russian Federation, the Ministry of Economic Development of Russia, the Federal Service for Accreditation, the Federal Agency on Technical Regulating and Metrology, the Federal Agency of Tourism, and Federal Agency for State Property Management.
The better business conditions are, the higher the demand on A-class offices is. Further plans on skyscrapers construction in Russia will directly depend on the economic development and attractiveness of the domestic market for foreign investors.