Legislative changes
Federal Law No. 48-FZ dated March 24th, 2021 amended the Federal Law "On the Fundamental Principles of Tourist Activities in the Russian Federation".
According to the adopted amendments, the Unified Federal Register of Travel Agents and Subagents (the Register) will operate in Russia from January 1st, 2022.
The information in the Register will include the following data:
- existence of contracts for the promotion and sale of tourist products between tour operators and travel agents, between travel agents and subagents, indicating areas of touristic activities (inbound tourism, outbound tourism, domestic tourism);
- dates of conclusion and validity of such contracts;
- possibility or impossibility of transfer by travel agents of tour operators' orders to execute in order to promote and sale tourist products by subagents;
- registry number of travel agent.
Travel agents and subagents data will be added to the Register automatically based on the data from the Unified State Register of Legal Entities and the Unified State Register of Sole Entrepreneurs.
Information about contracts for the promotion and sale of tourist products, dates of their conclusion and duration, as well as indications of the possibility or impossibility of concluding such contracts with subagents will be added to the Register by tour operators (travel agents) independently within no more than three working days from the date of conclusion of the contracts.
This can be done in electronic form in tour operator's personal account on the official website of the authorized federal executive authority on the Internet.
Promotion and sale of tourist products by travel agents or subagents is possible only if they are included in the Register, otherwise administrative liability is provided.
Starting from the date of amendments entering into the force a transition period of 180 days is provided in order to enter all the necessary information into the Register.
Users of Information and Analytical system Globas are able to access the information about all travel companies operating in Russia, which is over 47 thousand companies.
Trends in production of dairy products
Information agency Credinform represents a ranking of the largest Russian producers of dairy products.
The largest milk, butter, cheese and ice0cream producers with the highest annual revenue (TOP 1000) were selected for the ranking, according to the data from the Statistical Register and the Federal Tax Service for the latest available periods (2014 – 2020*). The selection and analysis of companies were based on the data of the Information and Analytical system Globas.
Net assets are total assets less total liabilities. This indicator reflects the real value of the property of an enterprise. When the company’s debt exceeds the value of its property, the indicator is considered negative (insufficiency of property).
The largest company in term of net assets is JSC WIMM BILL DANN, INN 7713085659, Moscow, production of milk (other than unpasteurized) and dairy products. In 2019, net assets value of the company exceeded 35 billion RUB.
The lowest net assets value among TOP 1000 belonged to JSC ALEV, INN 7302000183, Samara region, production of dairy products. The company was declared insolvent (bankrupt) and the bankruptcy proceeding has been initiating since July 27, 2020. In 2019, insufficiency of property of the legal entity was indicated in negative value of -2,9 billion RUB, and -3,4 billion RUB in 2020.
Covering the five-year period, the average net assets values of TOP 100 have a trend to increase with a negative growth rate (Picture 1).
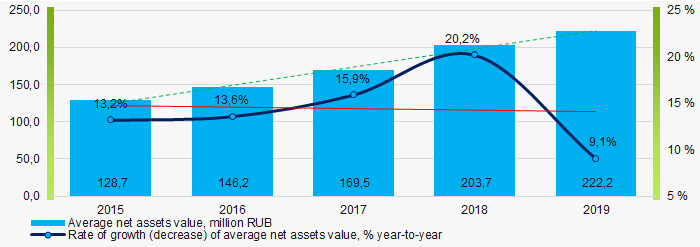 Picture 1. Change in industry average net assets value in 2015 – 2019
Over the past five years, the share of companies with insufficient property had a positive trend to decrease (Picture 2).
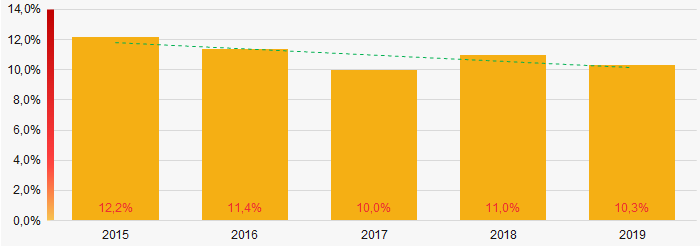 Picture 2. Shares of TOP 1000 companies with negative net assets value in 2015-2019
Sales revenue
In 2019, the revenue volume of ten largest companies was 33% of total TOP 1000 revenue (Picture 3). This is indicative of a quite high level of competition in the industry.
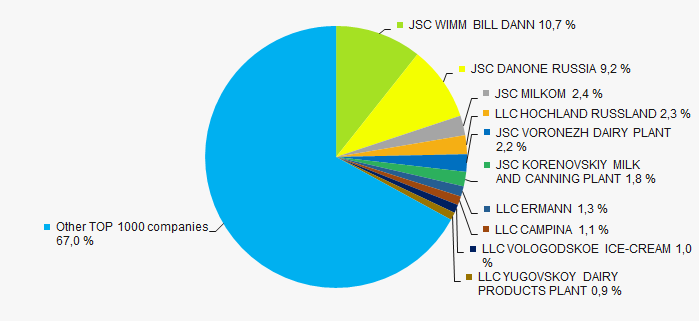 Picture 3. The share of TOP 10 companies in total 2019 revenue of TOP 1000
In general, there is a trend to increase in revenue with the decreasing growth rate (Picture 4).
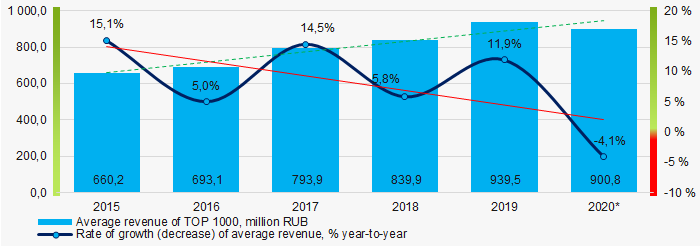 Picture 4. Change in industry average net profit in 2015 – 2020
Profit and loss
The largest organization in term of net profit is JSC DANONE RUSSIA, INN 7714626332, Moscow, production of dairy products. The company’s profit for 2019 exceeded 6 billion RUB.
Covering the six-year period, there is a trend to increase in average net profit with the decreasing growth rate (Picture 5).
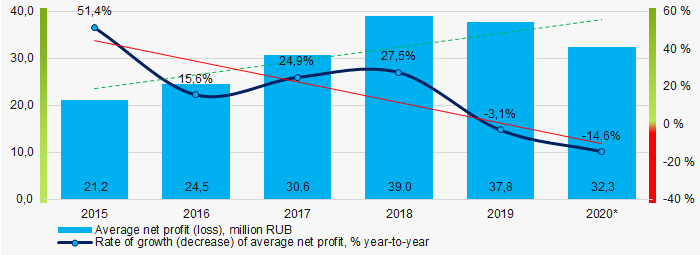 Picture 5. Change in industry average net profit (loss) values in 2015 – 2020
For the six-year period, the average net profit values of TOP 1000 have the increasing trend with the increasing net loss (Picture 6).
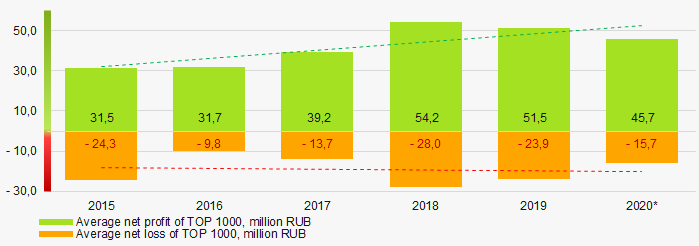 Picture 6. Change in average net profit and net loss of ТОP 1000 in 2015 – 2020
Key financial ratios
Covering the six-year period, the average values of the current liquidity ratio were above the recommended one - from 1,0 to 2,0 with a trend to decrease (Picture 7).
Current liquidity ratio (current assets to short-term liabilities) shows the sufficiency of company’s assets to repay on short-term liabilities.
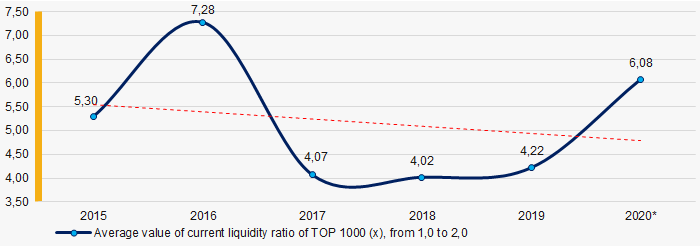 Picture 7. Change in industry average values of current liquidity ratio in 2015 – 2020
Covering the six-year period, the average values of ROI ratio had a trend to decrease (Picture 8).
ROI ratio is calculated as net profit to sum of shareholders equity and long-term liabilities, and shows the return of equity involved in commercial activities and long-term borrowed funds.
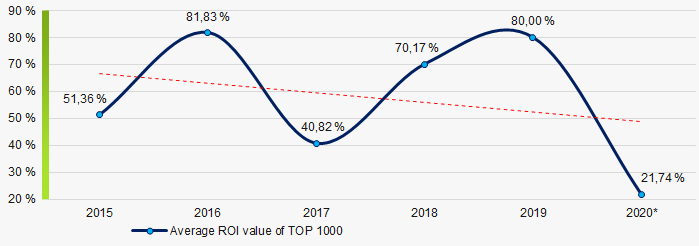 Picture 8. Change in industry average values of ROI ratio in 2015 - 2020
Assets turnover ratio is the ratio of sales revenue and company’s average total assets for a period. It characterizes the effectiveness of using of all available resources, regardless the source of their attraction. The ratio shows how many times per year the full cycle of production and circulation is performed, generating the corresponding effect in the form of profit.
Covering the six-year period, business activity ratio demonstrated the decreasing trend (Picture 9).
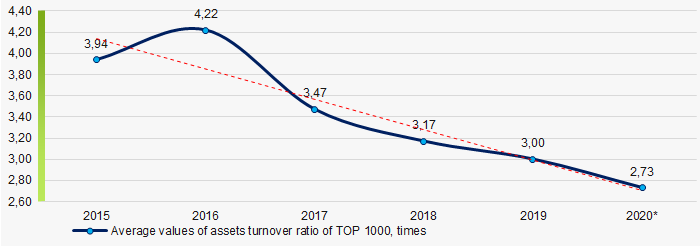 Picture 9. Change in average values of assets turnover ratio in 2015 – 2020
Small business
77% of companies included in TOP 1000 are registered in the Register of small and medium-sized enterprises of the Federal Tax Service of the Russian Federation. Their share in total revenue of TOP 1000 is 18,9% that is slightly lower than the average country values in 2018-2019 (Picture 10).
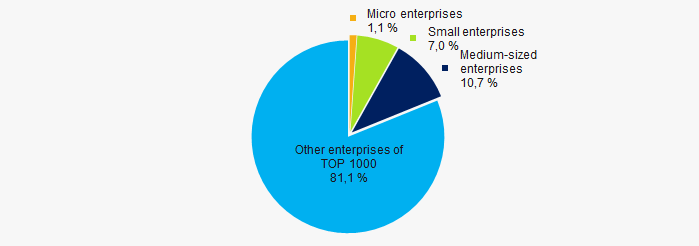 Picture 10. Shares of small and medium-sized enterprises in TOP 1000
Main regions of activity
Companies of TOP 1000 are registered in 79 regions of Russia, and unequally located across the country. Almost 30% of companies largest by total 2019 revenue are located in Moscow and Moscow region (Picture 11).
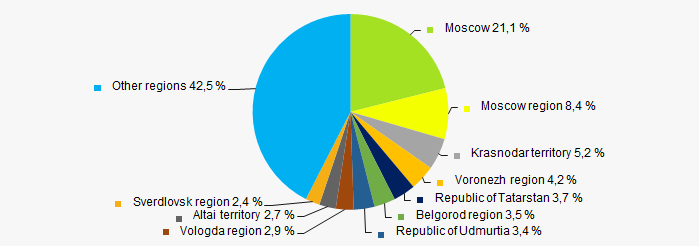 Picture 11. Distribution of TOP 1000 revenue by regions of Russia
Financial position score
Assessment of the financial position of TOP 1000 companies shows that the majority of them have financial position above average (Picture 12).
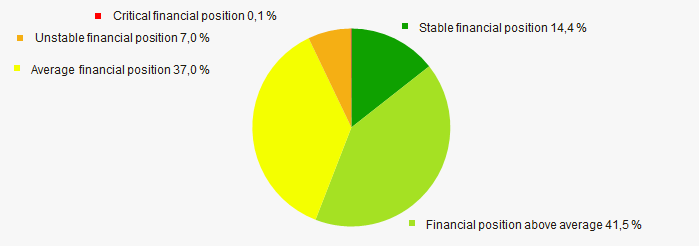 Picture 12. Distribution of TO -100 companies by financial position score
Solvency index Globas
Most of TOP 1000 companies got Superior / High and Strong / Medium indexes Globas. This fact shows their limited ability to meet their obligations fully (Picture 13).
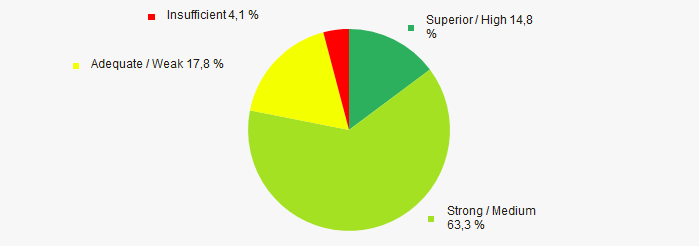 Picture 13. Distribution of TOP 1000 companies by solvency index Globas
Conclusion
Complex assessment of activity of the producers of dairy products, taking into account the main indexes, financial ratios and indicators, demonstrates the prevalence of positive trends in 2015 - 2020 (Table 1).
| Trends and evaluation factors | Relative share of factors, % |
| Dynamics of the average net assets value |  10 10 |
| Rate of growth (decrease) in the average size of net assets |  -10 -10 |
| Increase (decrease) in the share of enterprises with negative values of net assets |  10 10 |
| Level of competition / monopolization |  5 5 |
| Dynamics of the average revenue |  10 10 |
| Rate of growth (decrease) in the average size of revenue |  -10 -10 |
| Dynamics of the average profit (loss) |  10 10 |
| Rate of growth (decrease) in the average profit (loss) |  -10 -10 |
| Growth / decline in average values of companies’ net profit |  10 10 |
| Growth / decline in average values of companies’ net loss |  -10 -10 |
| Increase / decrease in average values of total liquidity ratio |  -5 -5 |
| Increase / decrease in average values of return on investment ratio |  -10 -10 |
| Increase / decrease in average values of asset turnover ratio, times |  -10 -10 |
| Share of small and medium-sized businesses in terms of revenue being more than 20% |  5 5 |
| Regional concentration |  -5 -5 |
| Financial position (the largest share) |  10 10 |
| Solvency index Globas (the largest share) |  10 10 |
| Average value of relative share of factors |  0,6 0,6 |
 positive trend (factor),
  negative trend (factor)
<p >(*) – 2020 data is given for companies submitted the accounting reports to the Federal Tax Service until March 2021