Herald
For how long shell companies have left?

The Federal Tax Service undertakes serious measures against shell companies since 2016, striking them off the Unified State Register of Legal Entities. The number of active legal entities in Russia reduced by 11% for two years.

There was a record reduction in a number of companies established for illegal actions – tax evasion, money laundering, cashing-out and withdrawing the funds abroad. According to the Federal Tax Service (hereinafter “the FTS”), the number of shell companies reduced to 309,5 th, that is 7,3% of total number of companies on July 2018.

At the beginning of 2016, there were significantly such kind of companies: 35,5% or 1,6 mln; and in 2011 about 40% of companies in Russia could be classified as shell companies.

As of July 1, 2018 totally 4,2 mln legal entities were registered in the Unified State Register of Legal Entities (hereinafter “EGRUL”). In the year-earlier period this figure exceeded 4,5 mln.

Not the FTS alone detects attributes of shell companies. The Bank of Russia also plays an important role in struggle against shell companies. Since 2015, the regulator publishes guidance notes demonstrating main doubtful business transactions and signs requiring additional analyses (see Picture 1).

"Picture 1. 
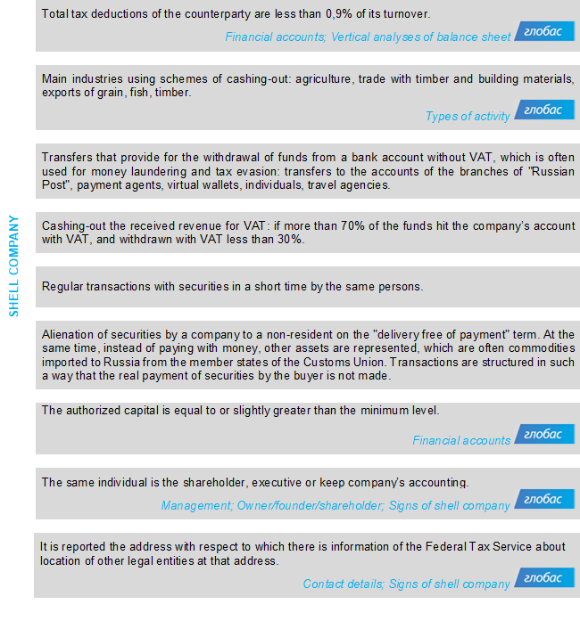
Picture 1. Signs of a shell company according to the instruction of the Central Bank

The majority of active Russian companies are located in Moscow – 885 th or 21% of total number of companies. 324 th and 222 th are accounted for Saint-Petersburg and Moscow region respectively. These subjects also leads by the number of dissolved companies: for the first half-year of 2018, 118 th companies were dissolved in Moscow, 33 th – in Saint-Petersburg, and 15 th – in Moscow region.

Newly established companies do not compensate the number of liquidated ones. For example, in Moscow the total number of business subjects decreased by 56 th for the first half-year of 2018 (see Table 1).

Table 1. The number of active and dissolved legal entities be regions, TOP-10
Region Legal entities, total for 01.07.2018 Share of total number of legal entities, % Legal entities established for the first half-year of 2018 Legal entities dissolved for the first half-year of 2018 Difference between the number of established and dissolved legal entities
  The Russian Federation 4 243 566 100 197 082 329 540 -132 458
1 Moscow 884 969 21 62 143 117 916 -55 773
2 Saint-Petersburg 324 202 8 19 053 33 479 -14 426
3 Moscow region 222 188 5 7 664 14 827 -7 163
4 Sverdlovsk region 145 226 3 4 967 8 989 -4 022
5 Krasnodar territory 135 736 3 5 553 9 563 -4 010
6 Novosibirsk region 117 931 3 5 516 6 654 -1 138
7 The Republic of Tatarstan 113 050 3 5 437 5 600 -163
8 Samara region 103 472 2 5 869 7 397 -1 528
9 Chelyabinsk region 93 484 2 2 843 5 024 -2 181
10 Nizhniy Novgorod region 89 433 2 3 658 6 305 -2 647


Totally 330 th companies were liquidated for the first half-year of 2018. Compulsory winding-up by the registering authority was the reason of termination of 283 th or 86% of companies (see Picture 2).

Almost 45 th or 13% of legal entities were dissolved due to economic reasons, including: liquidation – 33 th, reorganization – 7 th, bankruptcy – about 5 th.

"Picture 2. 
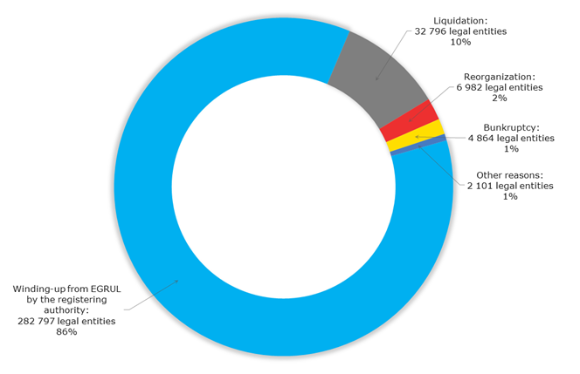
Picture 2. Reasons of termination of legal entities

On the background of obvious success in struggle against shell companies, there are cases when nonconformity to strictly specified formal criteria led to problems for genuinely operating companies.

All addresses with over ten companies registered at were automatically included in the FTS list of suspects. However, the compilers of lists of mass registration addresses did not take into account a number of large buildings and business centers with premises rented by hundreds of companies. According to Globas on July 2018, there is a record on unreliability of legal address for 612 th companies or over 14% of total number of active legal entities.

The list of directors / shareholders of multiple entities includes famous business people and public persons at the top of well-known brands, such as: Leonid Fridlyand, co-owner of the jewelry boutiques chain "Mercury". Georgy Boos, the former governor of Kaliningrad region, was also unlucky - according to the FTS, he is a shareholder of multiple entities, including LLC Likhoslavl Lighting Equipment Plant. Moreover, executives, in the name of who regional representative offices and branches were opened, appeared to be in "risk zone".

The FTS will obviously need to strike a balance between the formal struggle with shell companies and the interests of an honest entrepreneur. Tightening formal criteria will not stop unreliable counterparties, as getting around the rules is the goal of their existence, and it becomes more difficult for conscientious enterprises to fulfill ever-increasing requirements.

Article
Trends in alcoholic beverages wholesale

Information agency Credinform has prepared a review of trends of the largest alcoholic beverages wholesalers of Russia.

The largest wholesalers (TOP-1000) in terms of annual revenue were selected for the analysis according to the data from the Statistical Register for the latest available periods (2013-2018). The analysis was based on the data of the Information and Analytical system Globas.

Net assets are total assets less total liabilities. This indicator reflects the real value of the property of an enterprise. When the company’s debt exceeds the value of its property, the indicator is considered negative (insufficiency of property).

The largest company in term of net assets is JSC ROUST RUSSIA, NN 7705492717, Moscow. In 2018, net assets value of the company exceeded 14,9 billion RUB.

The lowest net assets volume among TOP-1000 belonged to LLC PIVNOY MIR, INN 8602241022, Moscow, in process of being wound up since 11.11.2015. In 2018, insufficiency of property of the company was indicated in negative value of -2,7 billion RUB.

Covering the ten-year period, the average net assets values of TOP-1000 companies have a trend to increase (Picture 1).

Picture 1. Change in average net assets value in 2009 – 2018 Picture 1. Change in average net assets value in 2009 – 2018

The shares of TOP-1000 companies with insufficient property have trend to increase over the past five years (Picture 2).

Picture 2. Shares of companies with negative net assets value in TOP-1000 Picture 2. Shares of companies with negative net assets value in TOP-1000

Sales revenue
In 2018, total revenue of 10 largest companies was almost 41% of TOP-1000 total revenue (Picture 3). This testifies high level of monopolization.

Picture 3. Change in industry average net profit in 2009-2018 Picture 3. Change in industry average net profit in 2009-2018

In general, there is a decrease in revenue (Picture 4).

Picture 4. Изменение средних отраслевых показателей выручки в 2009 – 2018 годах Picture 4. Изменение средних отраслевых показателей выручки в 2009 – 2018 годах

Profit and loss
The largest company in term of net profit is LLC DISTRIBUTING FIRM RUSLANA, INN 9108118124, the Republic of Crimea. The company’s profit for 2018 amounted to 579 million RUB.

Over the ten-year period, there is a trend to decrease in average net profit (Picture 5).

Picture 5. Change in industry average net profit values in 2009-2018 Picture 5. Change in industry average net profit values in 2009-2018

For the five-year period, the average net profit values of TOP-1000 companies increase with the average net loss value also having the increasing trend (Picture 6).

Picture 6. Change in average net profit and net loss of ТОP-1000 in 2009 – 2018 Picture 6. Change in average net profit and net loss of ТОP-1000 in 2009 – 2018

Key financial ratios
For the five-year period, the average values of the current liquidity ratio were above the recommended one - from 1,0 to 2,0 with a trend to decrease (Picture 7).

Current liquidity ratio (current assets to short-term liabilities) shows the sufficiency of company’s assets to repay on short-term liabilities.

Picture 7. Change in industry average values of current liquidity ratio in 2009 – 2018 Picture 7. Change in industry average values of current liquidity ratio in 2009 – 2018

For the ten-year period, the average values of ROI ratio have a trend to decrease (Picture 8).

ROI ratio is calculated as net profit to sum of shareholders equity and long-term liabilities, and shows the return of equity involved in commercial activities and long-term borrowed funds.

Picture 8. Change in average values of ROI ratio in 2009 – 2018 Picture 8. Change in average values of ROI ratio in 2009 – 2018

Assets turnover ratio is the ratio of sales revenue and company’s average total assets for a period. It characterizes the effectiveness of using of all available resources, regardless the source of their attraction. The ratio shows how many times per year the full cycle of production and circulation is performed, generating the corresponding effect in the form of profit.

For the ten-year period, business activity ratio demonstrated the decreasing trend (Picture 9).

Picture 9. Change in average values of assets turnover ratio in 2009 – 2018 Picture 9. Change in average values of assets turnover ratio in 2009 – 2018

Small enterprises
89% companies of TOP-1000 are registered in the Register of small and medium-sized enterprises of the Federal Tax Service of the Russian Federation. At the same time, their share in total revenue of TOP-1000 companies amounted to 28,1% that is higher than the national average figure (Picture 10).

Picture 10. Shares of small and medium-sized enterprises in TOP-100, % Picture 10. Shares of small and medium-sized enterprises in TOP-100, %

Main regions of activity
Companies of TOP-1000 are registered in 75 regions of Russia, and unequally located across the country. Almost 35% of companies largest by revenue are located in Moscow (Picture 11).

Picture 11. Distribution of TOP-100 revenue by regions of Russia Picture 11. Distribution of TOP-100 revenue by regions of Russia

Financial position score
Assessment of the financial position of TOP-1000 companies shows that the majority of them have average financial position (Picture 12).

Picture 12. Distribution of TOP-1000 companies by financial position score Picture 12. Distribution of TOP-1000 companies by financial position score

Solvency index Globas
Most of TOP-1000 companies got Superior / High and Strong / Medium index Globas. This fact shows their ability to meet their obligations fully (Picture 13).

Picture 13. Distribution of TOP-1000 companies by solvency index Globas Picture 13. Distribution of TOP-1000 companies by solvency index Globas

Conclusion
Complex assessment of activity of the largest alcoholic beverages wholesalers of Russia, taking into account the main indexes, financial ratios and indicators, demonstrates the prevalence of negative trends (Table 1).

Table 1. Positive and negative trends, evaluation factors
Trends and evaluation factors Relative share of factors, %
Rate of growth (decline) in the average size of net assets up10
Increase / decrease in the share of enterprises with negative values of net assets down-10
Rate of growth (decline) in the average size of revenue down-10
Level of competition down-10
Rate of growth (decline) in the average size of profit (loss) down-10
Growth / decline in average values of companies’ net profit up10
Growth / decline in average values of companies’ net loss down-10
Increase / decrease in average values of total liquidity ratio up5
Increase / decrease in average values of return on investment ratio down-10
Increase / decrease in average values of asset turnover ratio, times down-10
Share of small and medium-sized businesses in the region in terms of revenue being more than 22% up10
Regional concentration down-10
Financial position (the largest share) up5
Solvency index Globas (the largest share) up10
Average value of relative share of factors down-2,1

Up positive trend (factor), Down negative trend (factor).