
Order a report
Custom-made industry research, company ratings, competitor analysis


TOP-10 PROCUREMENTS AND SUPPLIERS. FEDERAL CONTRACT SYSTEM: THE FIRST RESULTS OF 2018
On December 18, 2018 292 th customers are registered in the Federal contract system in the procurements area. According to the 44-FL, 3 mln notices of procurement were posted, according to the 223-FL 1,3 mln were posted.
The total amount of announced procurements according to the 44-FL was 7 457 bln RUB, that is 5,3% higher than following the results of 2017. Value of procurements according to the 223-FL, otherwise, has almost by one third decreased, to 19 527 bln RUB. (look at picture 1). The reason can be found in decrease in amount of orders of JSC Rosneft. In 2017 the company purchased casing pipes for holes. Price of the largest procurement amounted to 859 bln RUB, total amount of orders exceeds 5 873 bln RUB; in 2018 amount of placed notices was significantly smaller – 308 bln RUB.
The main difference of two federal laws regulating contract system is in source of financing. In procurements according to the 223-FL, customer pays (performs) supply of product (work, service) at its own cost including via grants or funds received by income-generating operations and according to the 44-FL – using the funds of federal and local budgets.
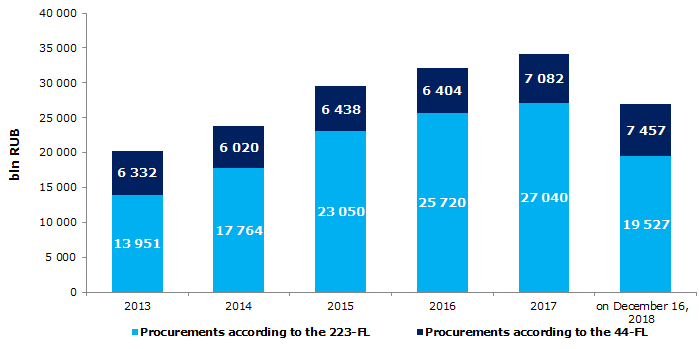 Picture 1. Total amount of procurements on placed notices, bln RUB.
The leader in terms of total amount of awarded contracts according to the 44-FL in 2018 is State Space Corporation ROSCOSMOS - 119 bln RUB. Object of the largest contract was valued at 61 bln RUB. – creation of medium-lift launch vehicle of new generation «Phoenix» (look at tables 1 and 2).
State Public Enterprise of Moscow Road and Bridge Construction Department with procurements amounted to 114 bln RUB and State Unitary Enterprise Moscow Metro with 113 bln RUB are the next in the rating of the largest customers.
Leaders of procurements according to the 223-FL have changed: JSC Russian Railways on mid-December of 2018 has made contracts on total amount of 1 130 bln RUB. In 2017 the largest customer was JSC ROSNEFT.
In recent years the largest amount of financing according to the 44-FL was distributed for the construction of the Crimean Bridge. In 2018 major financing was focused on works related to space exploration and construction of the Moscow Metro (look at table 2), that have already been estimated by citizens: the current year subway construction workers have built 15 stations – that is unprecedented rate over the history of development of metro in Russia.
Major part of procurements according to the 223-FL is related to the supply of fuel and oil mining, and orders of JSC Russian Railways.
| № | Procurement item,44-FL | Customer | Value, bln RUB | № | Procurement item, 223-FL | Customer | Value, bln RUB |
| 1 | Creation of medium-lift launch vehicle of new generation (design project code: «Phoenix») | State Space Corporation ROSCOSMOS | 61 | 1 | Supply of nonleaded gasoline of «Regular-92» brand, «Premium Euro 95» brand, EURO diesel fuel | LLC GAZPROM MEZHREGIONGAZ | 445 |
| 2 | Supply of subway railway carriages | State Unitary Enterprise Moscow Metro | 51 | 2 | Supply of limit gas | JSC MOSENERGO | 424 |
| 3 | Providing of contracted works for capital construction object: «Sokolnicheskaya subway line from Salaryevo station to Stolbovo station ». | State Public Enterprise Moscow Road and Bridge Construction Department | 41 | 3 | Providing of works on capital repair and modernization of traction equipment | JSC Russian Railways | 244 |
| 4 | Construction of launch vehicle «Angara». Site 1А. | State Public Enterprise Directory of the Vostochny Cosmodrom | 39 | 4 | Providing of works and services on construction of high priority objects and sections 4А and 5А of Achimovsky deposits of the Urengoy oil and gas condensate deposit | LLC ACHIM DEVELOPMENT | 143 |
| 5 | Providing of contracted works for capital construction object: «Construction of tunnel under Kaluga highway and multilevel road interchange in the area of TIH Stolbovo with approach roads». | State Public Enterprise Moscow Road and Bridge Construction Department | 28 | 5 | Supply of locomotives with obligation of maintenance during life cycle | JSC Russian Railways | 114 |