
Order a report
Custom-made industry research, company ratings, competitor analysis


Trends in financial intermediation
Information agency Credinform represents a review of activity trends among the largest companies engaged in provision of the auxiliary financial services.
The companies with the highest annual revenue (TOP 1000) engaged in financial intermediation - trading on stock, commodity, currency, currency and stock exchanges, brokerage, fund management, etc. - were selected for the ranking, according to the data from the Statistical Register and the Federal Tax Service for the latest available periods (2011 – 2020). The selection and analysis of companies were based on the data of the Information and Analytical system Globas.
Net assets are total assets less total liabilities. This indicator reflects the real value of the property of an enterprise. When the company’s debt exceeds the value of its property, the indicator is considered negative (insufficiency of property).
The largest company in term of net assets is ASSOCIATION OF FINANCIAL MARKET PARTICIPANTS NON-PROFIT PARTNERSHIP OF FINANCIAL MARKET DEVELOPMENT RTS, INN 7712095220, Moscow, activities to ensure the efficiency of the functioning of financial markets. In 2020, net assets value of the company exceeded 16 billion RUB.
The lowest net assets value among TOP 1000 belonged to LLC RVVT-FINANS, INN 7703662787, Moscow, activities auxiliary to financial services, excluding insurance and retirement benefits; the legal entity is in liquidation since 25.08.2016. In 2020, insufficiency of property of the enterprise was indicated in negative value of -7 billion RUB.
Covering the ten-year period, the average net assets values of TOP 100 have a trend to increase (Picture 1).
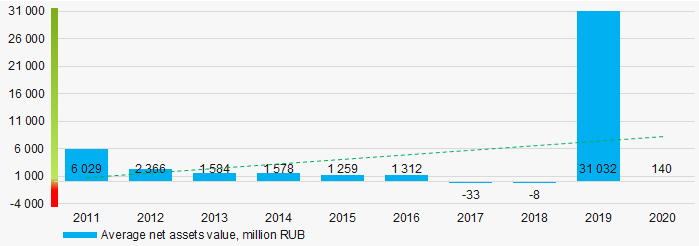 Picture 1. Change in industry average net assets value in 2011 – 2020
Over the past five years, the share of companies with insufficient property had no trend to decrease (Picture 2).
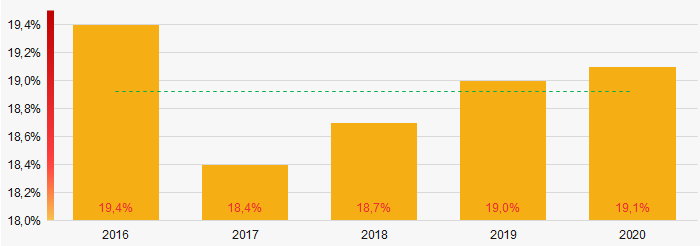 Picture 2. Shares of TOP 1000 companies with negative net assets value in 2016-2020
Sales revenue
In 2020, the revenue volume of ten largest companies exceeded 53% of total TOP 1000 revenue (Picture 3). This is indicative of a high level of monopolization in the industry.
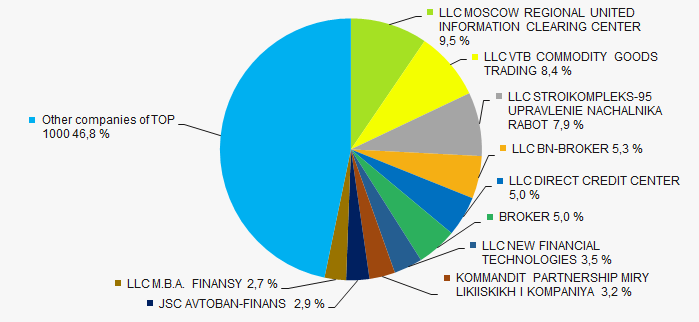 Picture 3. The share of TOP 10 companies in total 2020 revenue of TOP 1000
 In general, there is a trend to decrease in revenue and its growth rate (Picture 4).
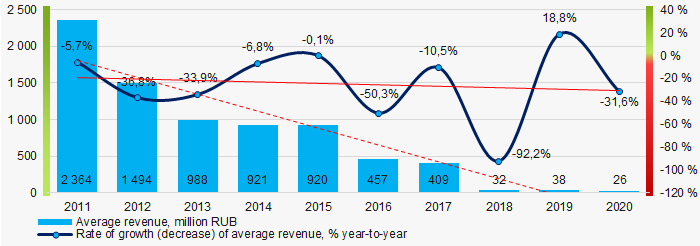 Picture 4. Change in industry average values of revenue in 2011 – 2020
Profit and loss
In 2020, the largest organization in term of net profit is JSC RUSAGRO GROUP, INN 5003077160, Tambov region, securities management. The company’s profit was near 12 billion RUB.
Covering the ten-year period, there is a trend to decrease in average net profit (Picture 5).
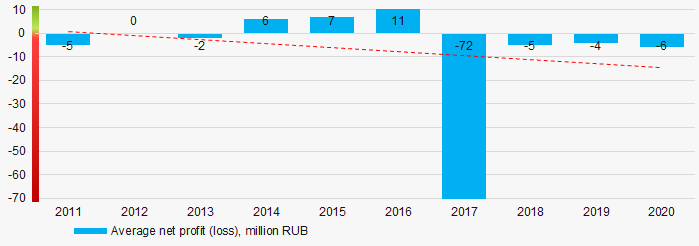 Picture 5. Change in industry average net profit (loss) values in 2011 – 2020
For the five-year period, the average net profit values of TOP 1000 have the increasing trend with the increasing net loss (Picture 6).
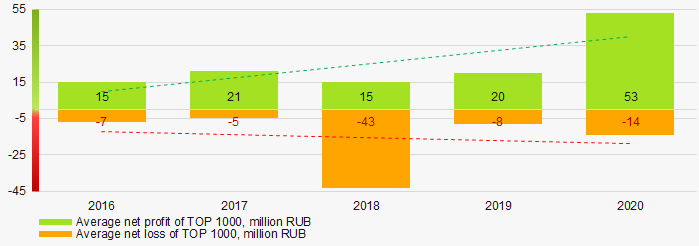 Picture 6. Change in average net profit and net loss of ТОP in 2016 - 2020
Key financial ratios
Covering the ten-year period, the average values of the current liquidity ratio were mainly within the recommended one - from 1,0 to 2,0 with a trend to decrease (Picture 7).
Current liquidity ratio (current assets to short-term liabilities) shows the sufficiency of company’s assets to repay on short-term liabilities.
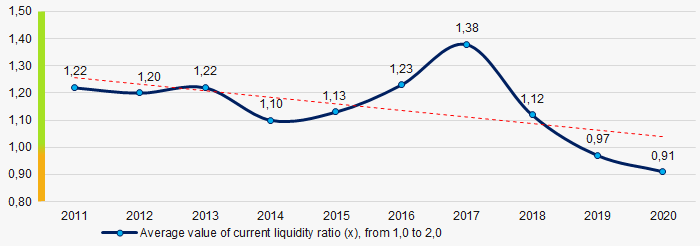 Picture 7. Change in industry average values of current liquidity ratio in 2011 – 2020
 Covering the ten-year period, the average values of ROI ratio had a trend to increase basically due to the results achieved in 2017-2018 (Picture 8).
ROI ratio is calculated as net profit to sum of shareholders equity and long-term liabilities, and shows the return of equity involved in commercial activities and long-term borrowed funds.
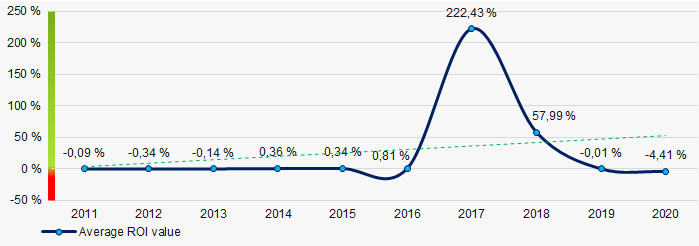 Picture 8. Change in industry average values of ROI ratio in 2011 - 2020
Assets turnover ratio is the ratio of sales revenue and company’s average total assets for a period. It characterizes the effectiveness of using of all available resources, regardless the source of their attraction. The ratio shows how many times per year the full cycle of production and circulation is performed, generating the corresponding effect in the form of profit.
Covering the ten-year period, business activity ratio demonstrated the decreasing trend (Picture 9).
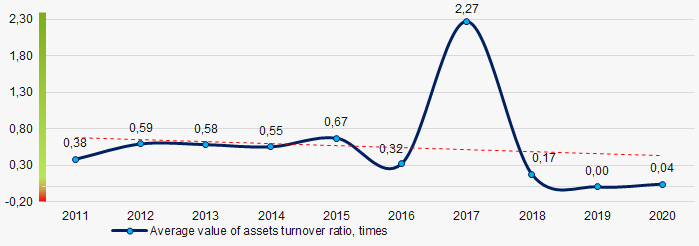 Picture 9. Change in average values of assets turnover ratio in 2011 – 2020
Small business
88% of companies included in TOP 1000 are registered in the Register of small and medium-sized enterprises of the Federal Tax Service of the Russian Federation. In 2020, their share in total revenue of TOP 1000 is more than 35%, much higher than the average country values in 2018-2019 (Picture 10).
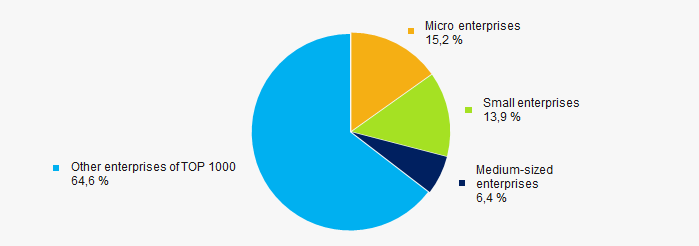 Picture 10. Shares of small and medium-sized enterprises in TOP 1000
Main regions of activity
Companies of TOP 1000 are registered in 77 regions of Russia, and unequally located across the country. Over 65% of companies largest by total 2020 revenue are located in Moscow and Moscow region (Picture 11).
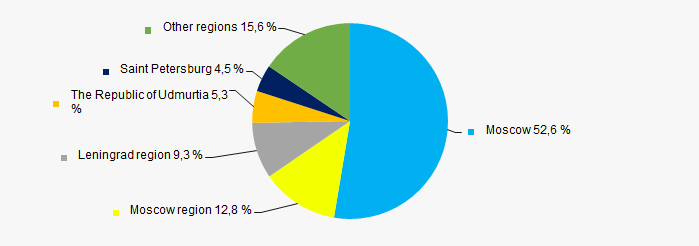 Picture 11. Distribution of TOP 1000 revenue by regions of Russia
Financial position score
Assessment of the financial position of TOP 1000 companies shows that the majority of them have average financial position (Picture 12).
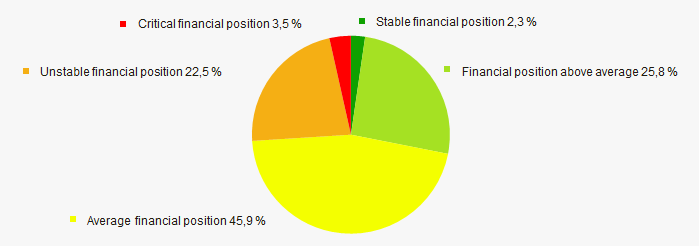 Picture 12. Distribution of TOP 1000 companies by financial position score
Solvency index Globas
Most of TOP 1000 companies got Adequate / Weak indexes Globas. This fact shows their limited ability to meet their obligations fully (Picture 13).
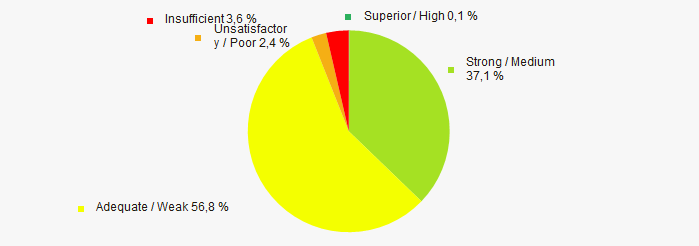 Picture 13. Distribution of TOP 1000 companies by solvency index Globas
Conclusion
Complex assessment of activity of companies engaged in activities auxiliary to financial services, taking into account the main indexes, financial ratios and indicators, demonstrates the prevalence of negative trends in 2011 - 2020 (Table 1).
| Trends and evaluation factors | Relative share of factors, % |
| Dynamics of the average net assets value | |
| Rate of growth (decrease) in the share of companies with negative net assets | |
| Level of competition / monopolization | |
| Dynamics of the average revenue | |
| Rate of growth (decrease) in the average size of revenue | |
| Dynamics of the average profit (loss) | |
| Growth / decline in average values of companies’ net profit | |
| Growth / decline in average values of companies’ net loss | |
| Increase / decrease in average values of total liquidity ratio | |
| Increase / decrease in average values of return on investment ratio | |
| Increase / decrease in average values of asset turnover ratio, times | |
| Share of small and medium-sized businesses in terms of revenue being more than 20% | |
| Regional concentration | |
| Financial position (the largest share) | |
| Solvency index Globas (the largest share) | |
| Average value of relative share of factors | |
![]() positive trend (factor),
positive trend (factor), ![]() negative trend (factor)
negative trend (factor)