
Order a report
Custom-made industry research, company ratings, competitor analysis


Trends in manufacturing of medical devices and equipment
Information Agency Credinform presents a review of trends in manufacturing of medical devices and equipment.
The enterprises of the sector with the highest volume of annual revenue (TOP-10 and TOP-800) have been selected for the ranking, according to the data from the Statistical Register for the latest available accounting periods (2015 and 2016). The analysis was based on the data from the Information and Analytical system Globas.
Legal forms and unverified data
Limited liability company is the prevailing legal form among companies of the sector. Non-public joint stock companies’ fraction is significant too (Picture 1).
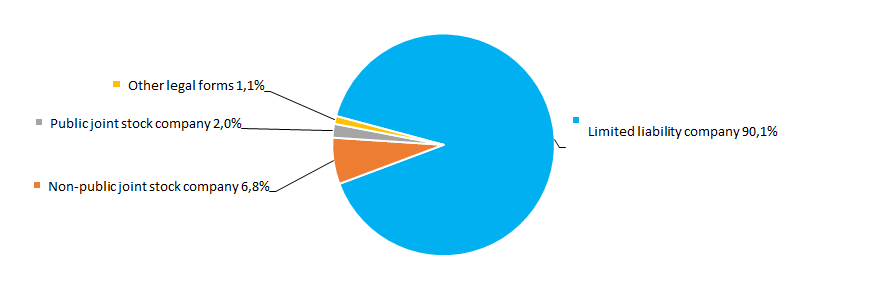 Picture 1. TOP-800 companies by legal forms
As a result of investigations by the Federal Tax Service of Russia, almost 4% of the companies of the sector have faced entries concerning unverified data in the Unified State Register of Legal Entities (Picture 2).
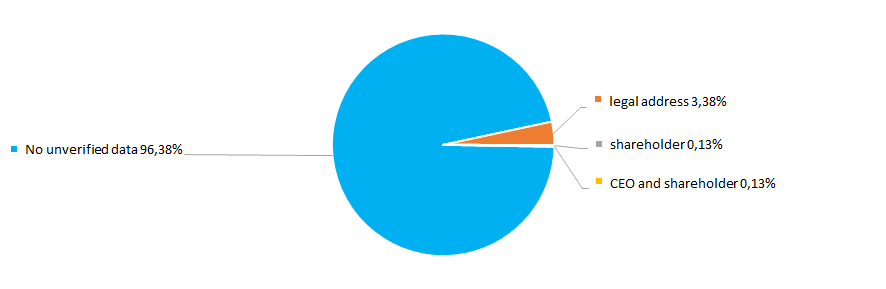 Picture 2. TOP-800 companies by entries concerning unverified data in EGRUL
Sales revenue
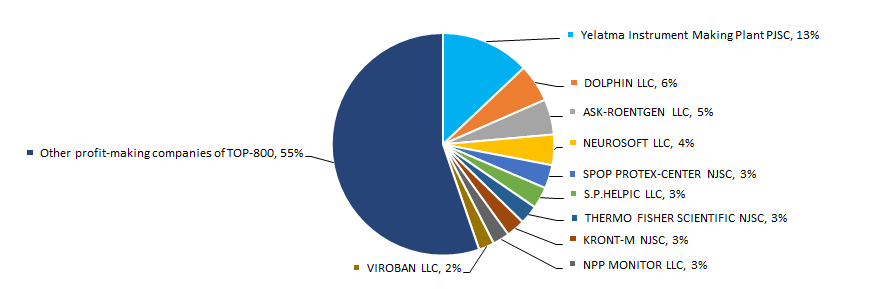
In 2016 sales revenue of TOP-10 companies amounted to 18% of total revenue of TOP-5000 companies. This points to a high degree of business competition within the industry. PJSC Yelatma Instrument Making Plant is the largest company in 2016 by revenue. It is one of the largest Russian company that produces medical devices, therapy equipment for home and hospital usage, disinfection equipment, medical furniture, and disposables (Picture 3).
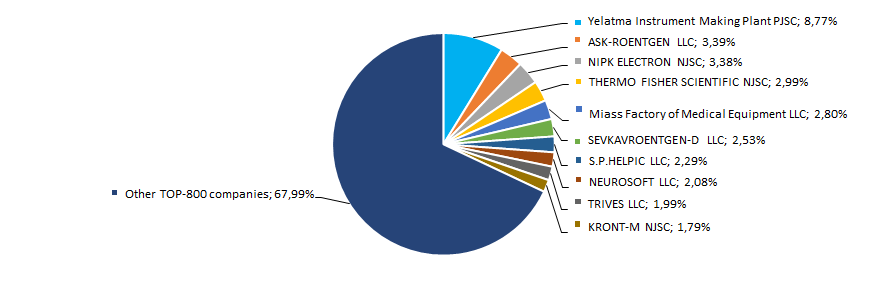 Picture 3. TOP-10 companies by their share in 2016 total revenue of TOP-800
2015 witnessed the best revenue results in the decade for the industry in general. Crisis periods in economy of 2012-2014 resulted in decrease in industry average values. In general, revenue demonstrates revenue increase (Picture 4).
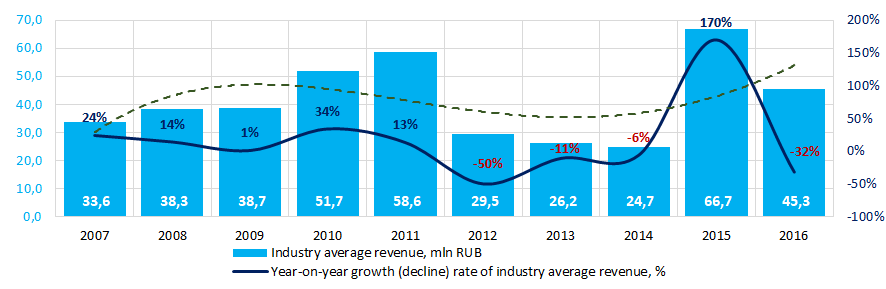 Picture 4. Change in industry average revenue of medical devices and equipment manufacturers in 2007 – 2016
Profit and loss
In 2016 profit of 10 industry leaders amounted to 45% of total profit of TOP-800 companies. PJSC Yelatma Instrument Making Plant is also the leading company by profit in 2016 (Picture 5).
 Picture 5. TOP-10 companies by their share in 2016 total profit of TOP-800 companies
Average profit values of the companies of the sector are not stable within the decade. There were negative values in 2009 – 2011. In general, profit tends to increase since 2012. The industry has performed its best in 2007 (Picture 6).
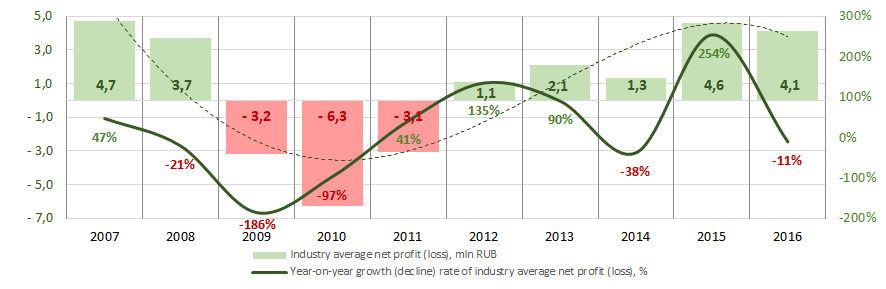 Picture 6. Change in industry average profit of medical devices and equipment manufacturers in 2007 – 2016
There were 174 loss-making enterprises (or 22%) among TOP-800 companies in 2015. In 2016 the number decreased to 15 or by 20% for TOP-800. Moreover, their average loss decreased by 24%. Average profit of other TOP-800 companies has increased by 10% for the same period (Picture 7).
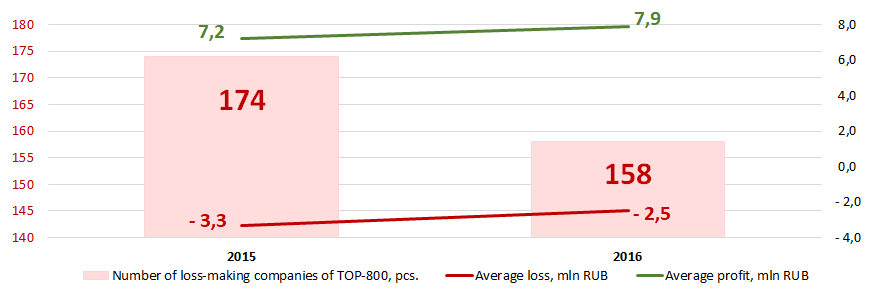 Picture 7. Number of loss-making companies, average values of loss and profit of TOP-800 companies in 2015 – 2016
Key financial ratios
During the decade industry average values of liquidity coverage ratio were within the recommended value – from 1,0 to 2,0, excluding 2012 and 2015 (Picture 8). In general, the ratio value tends to decrease.
Liquidity coverage ratio (a ratio of current assets to current liabilities) reveals the sufficiency of a company’s funds for meeting its short-term liabilities.
Solvency ratio (a ratio of shareholders’ equity to total assets) shows the dependence of the company on external loans. Its recommended value: >0,5. A value less than a minimum one is indicative of a strong dependence on external sources of funds.
A calculation of practical values of financial ratios, which might be considered as normal for a certain industry, has been developed and implemented in the Information and Analytical system Globas-i by the experts of Information Agency Credinform, having taken into account the current situation in the economy as a whole and in the industries. The practical value of solvency ratio for medical devices and equipment manufacturers in 2016 is from 0,13 to 0,95.
During the decade industry average values of the ratio were within the recommended value, and higher than the practical value (Picture 8).
In general, the ratio tends to decrease.
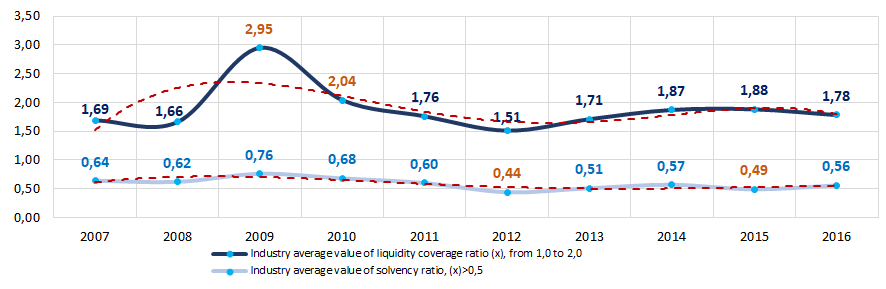 Picture 8. Change in industry average values of liquidity coverage ratio and solvency ratio of medical devices and equipment manufacturers in 2007 – 2016
The return on investment ratio was not stable during the decade, however, tending to increase since 2012. Ratio values became negative in 2009 – 2011 (Picture 9). It is a ratio of net profit to shareholders’ equity and noncurrent liabilities, and it demonstrates benefit from shareholders’ equity engaged in business activity and long-term raised funds of the company.
Cost to revenue ratio was more stable, and tended to increase since 2013 (Picture 9). The ratio is calculated as a ratio of sales profit to operation costs. In general, it reflects production efficiency.
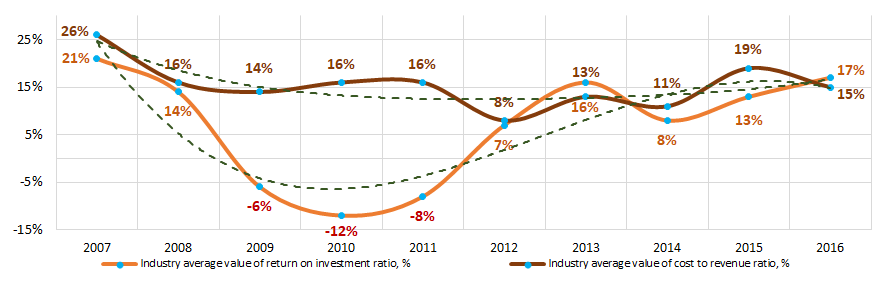 Picture 9. Change in industry average values of return on investment ratio and cost to revenue ratio of medical devices and equipment manufacturers in 2007 – 2016
Assets turnover ratio is a ratio of sales revenue to average total assets for the period, and measures resource efficiency regardless of the sources. The ratio indicates the number of profit-bearing complete production and distribution cycles per annum.
Shareholders’ equity turnover ratio is a ratio of revenue to annual average shareholders’ equity, and indicates total assets usage rate.
During the decade both activity showed an increasing trend (Picture 10).
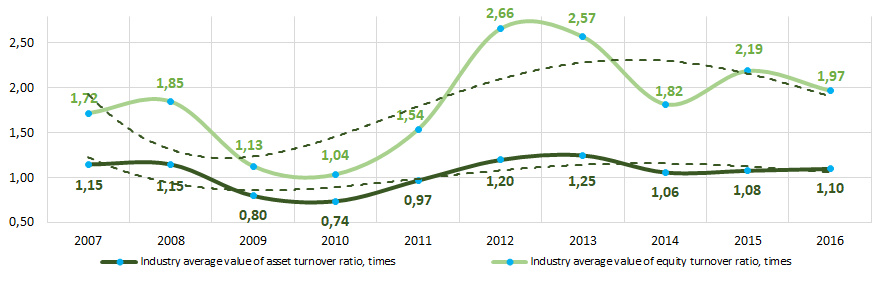 Picture 10. Change in industry average values of activity ratios of medical devices and equipment manufacturers in 2007 – 2016
Production structure
Most of TOP-800 companies specializes in manufacturing of medical x-ray, alpha, beta and gamma ray equipment (Picture 11).
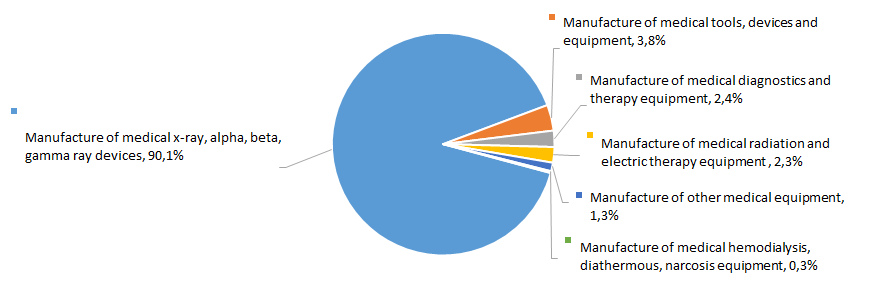 Picture 11. TOP-800 companies by types of production, %
Business activity trends
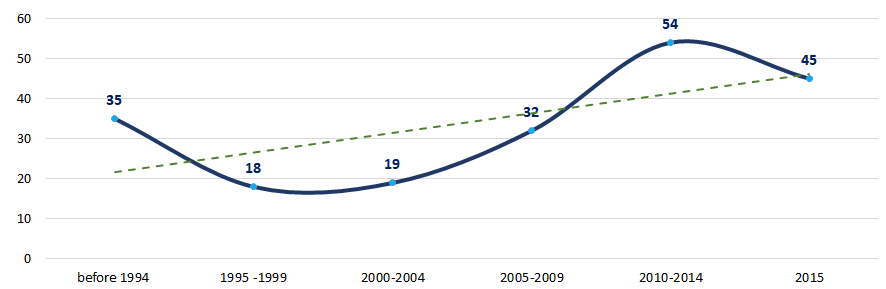
There is a diversity in distribution of registered TOP-800 companies by the year of their foundation within a 25-year period. Most of the companies were founded in 2013. In general, there is a trend of increase in the amount of companies being registered (Picture 12).
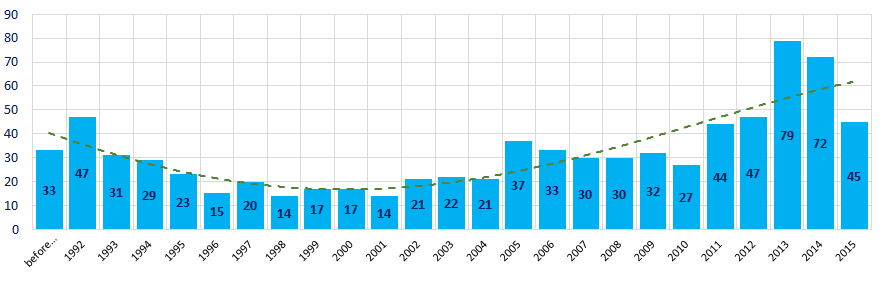 Picture 12. TOP-800 companies by the year of foundation
Private sector has shown the strongest interest in medical devices and equipment manufacturing in 2010 – 2014 (Picture 13).
 Picture 13. Average number of TOP-800 companies registered per year, by their foundation periods
Key home regions
Companies of the sector are unevenly distributed throughout Russia. Most of them are registered in Moscow and Saint Petersburg, which are the regions with the most extensive infrastructure for high-tech manufacturing (Picture 14).
TOP-800 companies are registered in 72 regions of Russia.
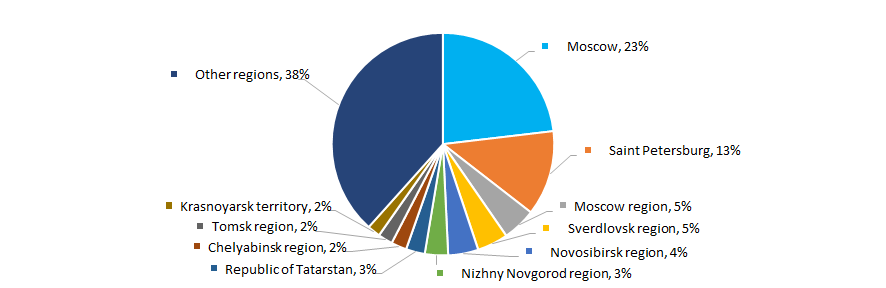 Picture 14. TOP-800 companies by regions of Russia
Most companies of the sector are accumulated in the Central Federal District of Russia (Picture 15).
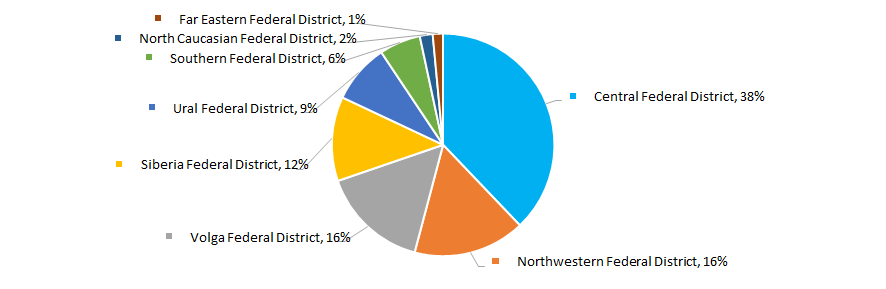 Picture 15. TOP-800 companies by federal districts of Russia
3% of TOP-800 companies have branches or representative offices.
Participation in arbitration proceedings
Most companies of the sector either do not participate in arbitration proceedings or participate in a small number of proceedings (Picture 16).
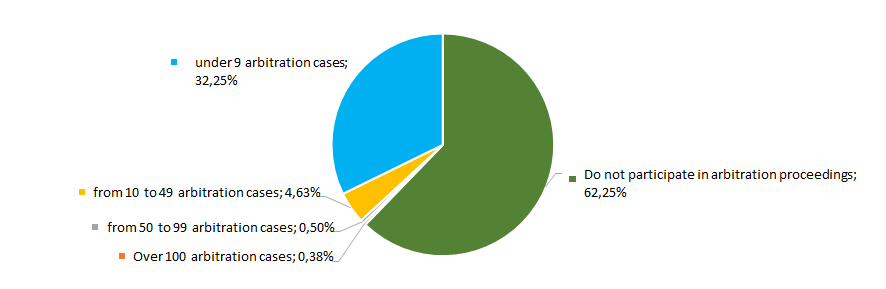 Picture 16. TOP-800 companies by their participation in arbitration proceedings
Reliability index
The risk of meeting a fly-by-night company or an unreliable company is extremely low for the most companies of the sector (Picture 17).
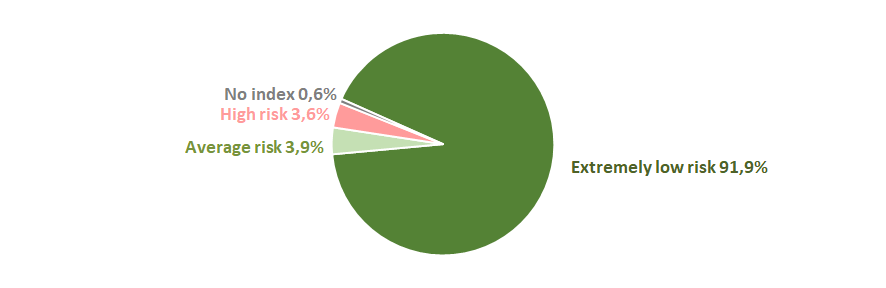 Picture 17. TOP-800 companies by Reliability index
Financial position score
Assessment of financial state of the sector’s companies indicates that most of the companies have an average or unstable financial standing (Picture 18).
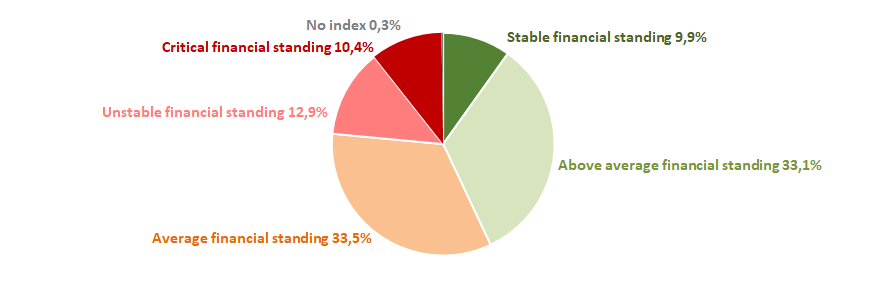 Picture 18. TOP-800 companies by Financial position score
Liquidity index
There is an extremely low risk of bankruptcy in the short term for over a half of the companies of the sector (Picture 19).
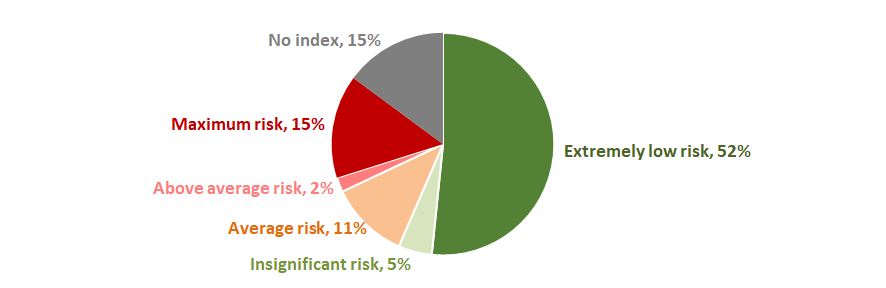 Picture 19. TOP-800 companies by Liquidity index
Solvency index Globas
Most TOP-800 companies have got a superior, high, strong and medium Solvency index Globas, which indicates their ability to meet debt obligations timely and in full (Picture 20).
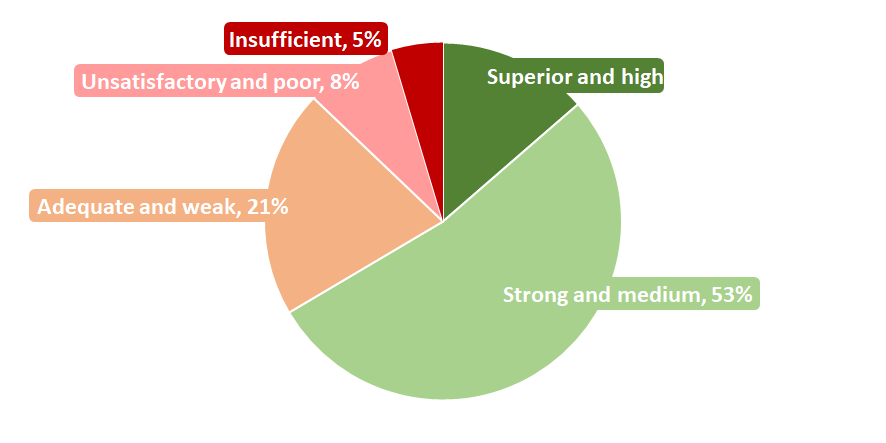 Picture 20. TOP-800 companies by Solvency index Globas
Therefore, a comprehensive assessment of medical devices and equipment manufacturers that considers key indexes, financial figures and ratios, is indicative of positive trends in the sector.