
Order a report
Custom-made industry research, company ratings, competitor analysis


High-growth companies will determine the future of the economy
Dynamically developing companies create new markets, implement technologies, set professional standards and form consumer preferences. The key condition for gazelle companies is high growth rate: minimum by 20-30% annually for at least 4 years. Gazelle companies are the most successful and stable-growing companies, providing new jobs, contributing to the GDP increase, and being able to influence the domestic economy growth and be the marker of structural changes.
Are the Russian gazelles able to become the engine of the economy?
The Russian gazelle companies were studied with the Information and Analytical system Globas. Companies with at least 30% of annual growth were selected out of 3,5 million active commercial entities. Revenue exceeding 50 million RUB, and positive net assets were recorded for these companies in 2018.
Regions of activity
About 1% or a little over 3 thousand Russian entities fall under the gazelles criteria. Total 2018 turnover of 5,2 trillion RUB is 2,8% of turnover of all entities. There are from 1% to 5% of gazelle companies in developed economies. At the same time, up to 50% of GDP growth fall for their share.
The majority or 26% of gazelles are located in Moscow, 9% - in Saint Petersburg, and 6% - in Moscow region. By total revenue, high-growth companies from Saint Petersburg are almost close to those from Moscow: gazelles from Saint Petersburg accumulate 1,3 trillion RUB of revenue, and the Moscow ones have 1,5 trillion RUB. Other regions are significantly behind the leaders by both the number of companies and total revenue.
Gazelles are presented in almost all subject of Russia, excluding the Republics of Dagestan and Ingushetia, and sparsely populated Chukotka and Nenets autonomous districts.
Size of the Russian gazelles
The majority of high-growth companies do not fall under the category of large business. Only 8% of companies have 2018 revenue exceeding 2 billion RUB. 44% of total number of gazelles have revenue from 120 million RUB to 800 million RUB.
In general, high-growth companies became lager for the researched 4 years: in 2015, the revenue of 1% of gazelles exceeded 2 billion RUB. The main share fell for companies with turnover up to 120 million RUB (see Picture 1).
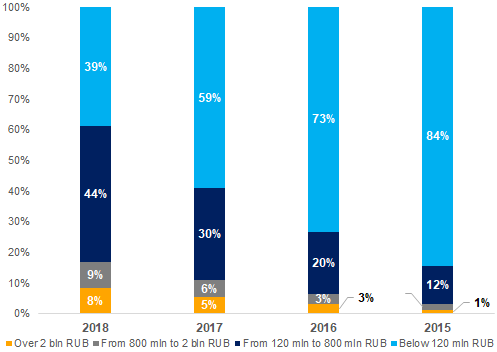 Picture 1. Distribution of high-growth companies by annual revenue
Economic sectors
1 210 companies or 38% of total number of gazelles are engaged in wholesale and retail trade. This sector accumulates the majority of total revenue: 2,4 trillion RUB or 45% of total gazelles’ revenue (see Picture 2).
There are no gazelles in mining. Mainly large companies occupy this sector, and the majority of gazelles are medium-sized and small companies.
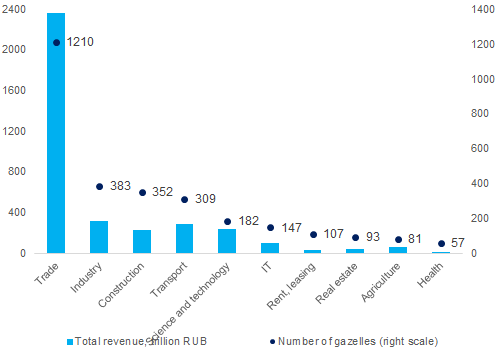 Picture 2. Distribution of high-growth companies by economic activity; total revenue for 2018
Leaders
Table 1 presents the largest gazelles in term of revenue. They are included in TOP-10 of economic sectors with the highest number of gazelles involved. The table contains well-known brands, such as Pyatyorochka retail chain, airline company AZUR air, Spasibo by Sberbank and companies engaged in industries the products of which have until recently been mainly imported (production of large-diameter pipes, for instance).
Table 1. TOP-10 of sectors by the number of high-growth companies represented by the revenue leaders
| Rank | Sector | Company | Revenue in 2018, billion RUB | Average growth of revenue in 2015-2018, % | Scope of business |
| 1 | Trade | LLC AGROTORG | 1 036 | 75 | Pyatyorochka retail chain |
| 2 | Industry | ZAGORSK PIPE PLANT JSC | 39 | 317 | Production of large-diameter pipes |
| 3 | Construction | LLC SPETSTRANSSTROY | 21 | 701 | Construction of transport infrastructure |
| 4 | Transport | AZUR air LLC | 44 | 174 | Charter service |
| 5 | Science and technology | JSC NIPIGAZPERERABOTKA | 115 | 167 | Development and design in oil and gas industry |
| 6 | Information technologies | JSC CENTRE OF LOYALTY PROGRAMMERS | 26 | 57 | Spasibo service by Sberbank |
| 7 | Rent, leasing | LLC LIZPLAN RUS | 3 | 214 | Corporate car leasing |
| 8 | Real estate | LLC OPERATOR OF COMMERCIAL REAL ESTATE | 11 | 1 635 179 | Lease of storage facilities |
| 9 | Agriculture | LLC AGROTEK-VORONEZH | 7 | 249 | Pork production |
| 10 | Health | LLC A410 | 2 | 197 | Aesthetic pharmaceuticals and cosmetology under the Allergan brand |
Conclusion
The number of the Russian high-growth companies is compatible by the level with the developed economies. However, their contribution to the domestic product is significantly less. The potential of the Russian gazelles is not unleashed yet. The majority of high-growth companies by both the number and total revenue are engaged in trade and this sector creates no higher value-added unique product. Only after the existing imbalance is eliminated through the accelerated development of industry, IT and science, it will be possible to talk about the qualitative transformation of domestic GDP, including due to the contribution of gazelle companies.