
Order a report
Custom-made industry research, company ratings, competitor analysis


Trends in the field of marine fishery
Information agency Credinform presents overview of trends in the field of marine fishery.
The companies with the highest volume of revenue (TOP-100 and TOP-1000) were selected for the analysis, according to the data from the Statistical Register for the latest available periods (for 2016 and 2015). The analysis was based on the data from the Information and Analytical system Globas.
Legal forms and unreliable data
The most widespread legal form is a limited liability company. Non-public joint-stock companies and fishery work associations also make a significant share. (Picture 1).
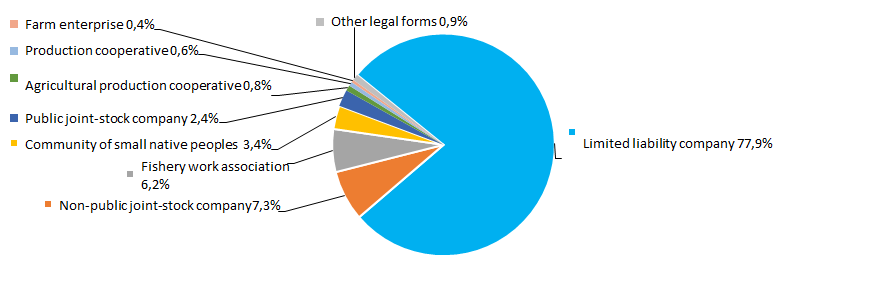 Picture 1. Distribution of TOP-1000 companies by legal forms, %
According to the results of investigation of the Federal Tax Service of the RF, 2,9% companies of the industry have records of unreliable data brought in the Unified Register of Legal Entities (EGRUL) (Picture 2).
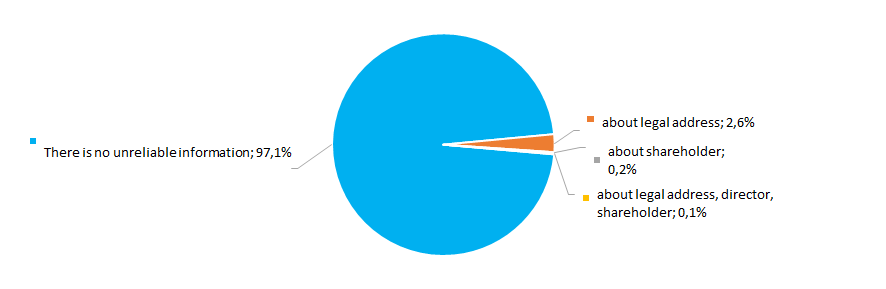 Picture 2. Shares of TOP-1000 companies, with records in the EGRUL about unreliable data, %
Sales revenue
Revenue volume of 10 leaders of the industry in 2016 was 25% of the total revenue of the 1000 largest companies. The largest company in terms of revenue volume in 2016 became JSC OKEANRYBFLOT (Picture 3).
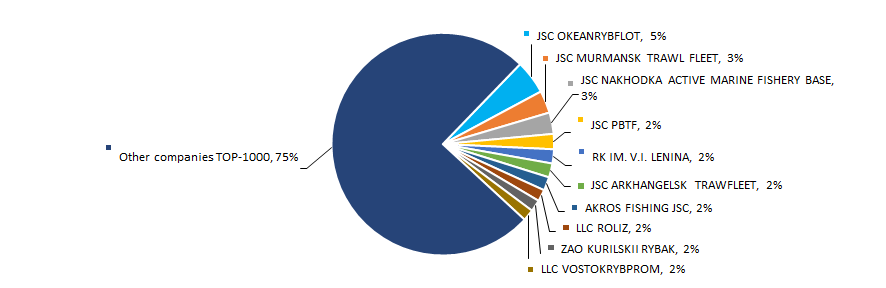 Picture 3. Shares of TOP-10 companies in the total revenue of TOP-1000 in 2016, %/strong>
The best results in the industry in terms of revenue volume for ten years were achieved in 2016. During crisis periods in the economy in 2010 and from 2012 to 2014 decrease of average industrial indicators was observed. (Picture 4).
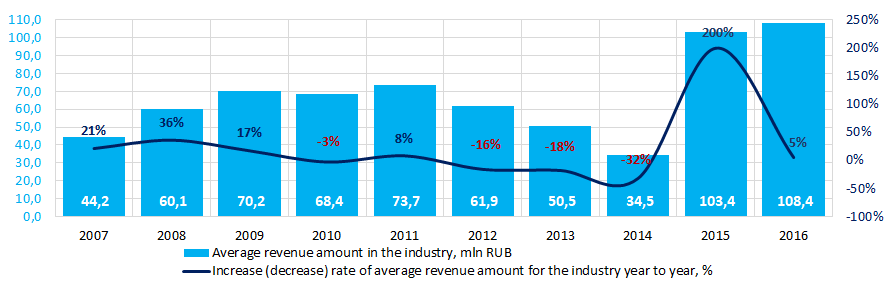 Picture 4. Change of the average industrial indicators of revenue of the companies involved in the field of marine fishery in 2007 – 2016
 Profit and loss
Profit volume of the 10 largest companies in the industry in 2016 was 37% of the total profit of TOP-1000 companies. JSC OKEANRYBFLOT also takes lead according to the profit volume in 2016 (Picture 5).
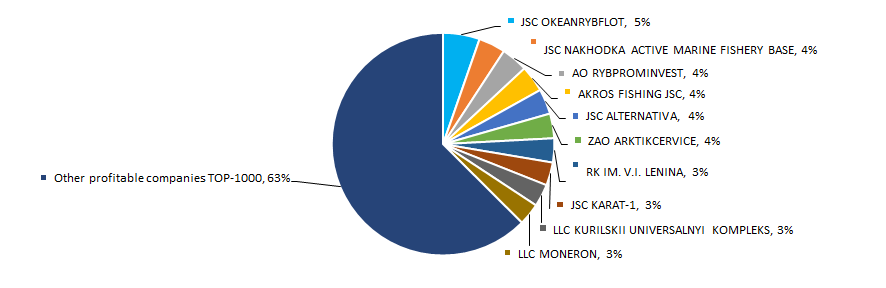 Picture 5. Shares of TOP-10 companies in the total profit volume of TOP-1000 companies in 2016, %
The average industrial values of profit of companies for ten years are not stable. Decrease of indicators was observed in 2012 - 2014 on the backwards of crisis phenomena in the economy. The best results were achieved in 2016. (Picture 6).
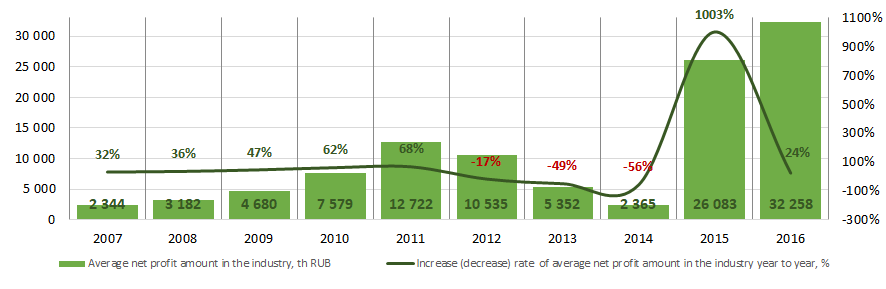 Picture 6. Change of the average industrial profit values of marine fishery companies in 2007 – 2016
 269 loss-making companies were observed in 2015 among TOP-1000 companies. In 2016 their amount decreased to 254 or almost to 6%. Besides, average loss amount has 32% decreased. For the rest TOP-1000 companies average profit amount decreased to 11% for the same period (Picture 7).
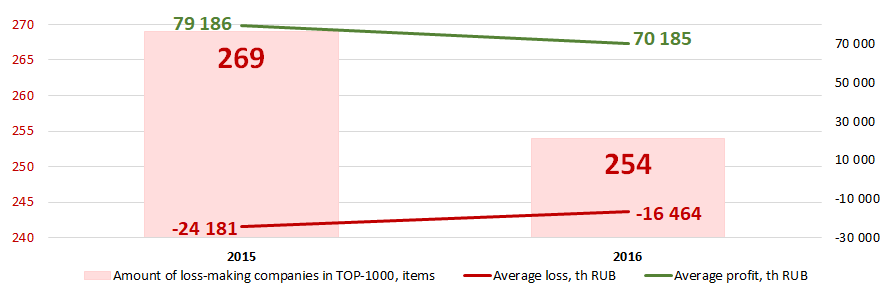 Picture 7. Amount of loss-making companies, average values of profit and loss of TOP-1000 companies in 2015 – 2016
 Key financial ratios
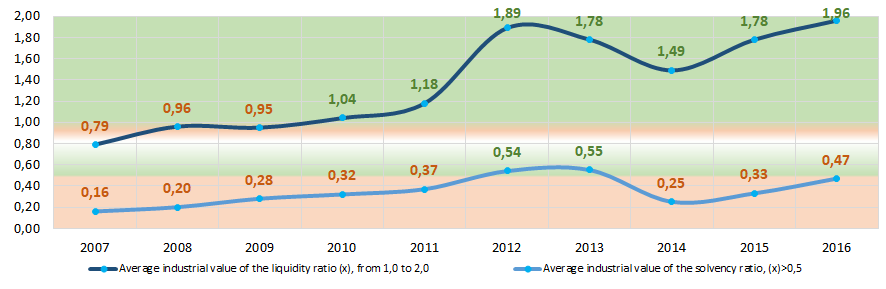
For ten years the average industrial values of the current liquidity ratio beginning from 2010 are in the interval of recommended values - from 1,0 to 2,0. (Picture 8).
Current liquidity ratio (current assets to short-term liabilities of the company) shows the adequacy of the enterprise's funds to pay off its short-term obligations. .
Solvency ratio (equity to total assets) shows the dependence of the company on external loans. The recommended value: >0,5. A value less than a minimum one indicates dependence on external sources of funds.
A calculation of practical values of financial ratios, which might be considered as normal for a certain industry, has been developed and implemented in the Information and Analytical system Globas by the experts of Information Agency Credinform, having taken into account the current situation in the economy as a whole and in the industries. The practical value of solvency ratio for marine fishery companies in 2016 amounts from 0,01 to 0,99.
Average industrial indicators of the ratio were within the interval of recommended value in 2012 and 2013 and within the interval of practical values during decade period (Picture 8).
 Picture 8. Change of average industrial values of the current liquidity and solvency ratios of marine fishery companies in 2007 – 2016
 Over a ten-year period instability of indicators of the return on investments ratio is observed. During crisis periods in the economy (2008, 2012, 2013) indicators were decreasing from year to year (Picture 9). The ratio is net profit to the total equity and long-term liabilities and demonstrates profit from the equity involved into commercial activities and long-term external funds of the company.
During the same period indicators of the product profitability ratio steadily increased (Picture 9). The highest growth of the indicators was observed in 2015 - 2016. The ratio is sales revenue to expenses from ordinary activities. In general, profitability indicates the economic efficiency of production.
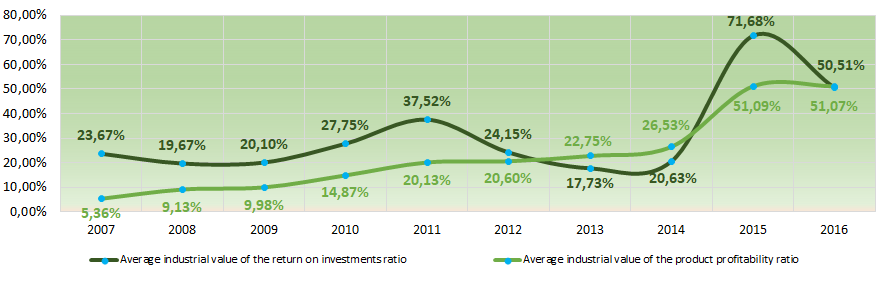 Picture 9. Change of average industrial values of the return on investments and product profitability ratios of marine fishery companies in 2007 – 2016
 Indicators of the assets turnover ratio for ten years demonstrate relative stability with soft decrease and increase periods (Picture 10).
The assets turnover ratio is sales revenue to average total assets for a period and characterizes the effectiveness of using of all available resources, regardless the source of their attraction. The ratio shows how many times per year the full cycle of production and circulation is performed, generating profit.
The equity turnover ratio is calculated as a ratio of revenue to yearly average sum of equity and demonstrates the company’s usage rate of total assets. From 2007 to 2012 a significant decrease of the indicators was observed with following increase in 2014 – 2015 (Picture 10).
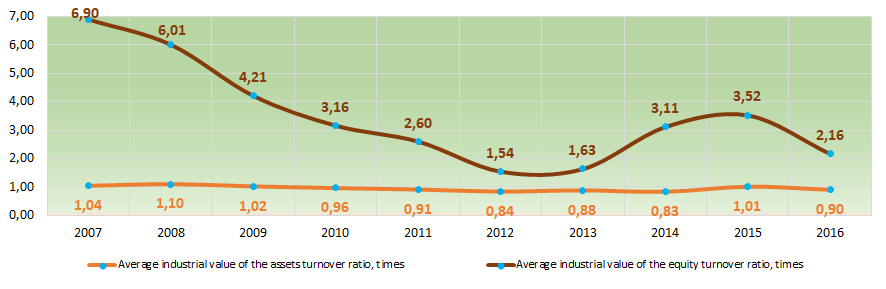 Picture 10. Change of average industrial values of the business activity ratios of marine fishery companies in 2007 – 2016
 Dynamics of business activity
Over a 25-year period, the registered companies from TOP-1000 list are unequally distributed by the year of foundation. Most of the companies engaged in marine fishery were founded in 1998 and 2011 (Picture 11).
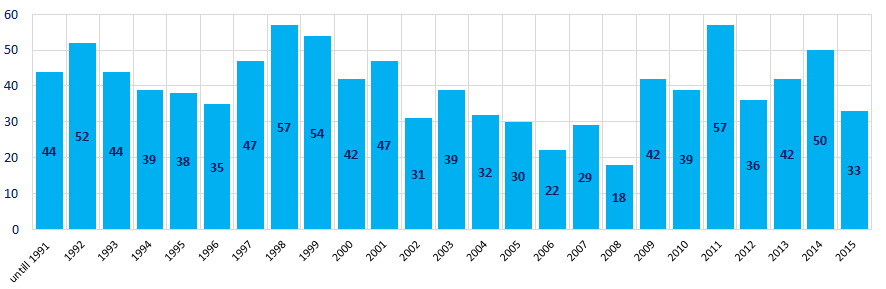 Picture 11. Distribution of TOP-1000 companies in terms of years of foundation
 Marine fishery industry attracted the most interest of business until 1999 and during 2010 – 2014, when at average 45 – 46 companies were registered per year. (Picture 12).
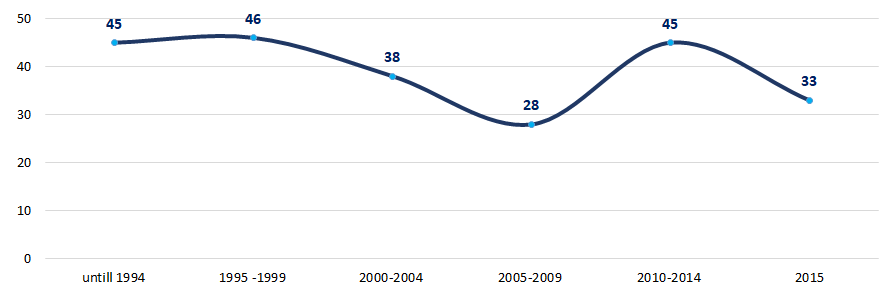 Marine fishery industry attracted the most interest of business until 1999 and during 2010 – 2014, when at average 45 – 46 companies were registered per year. (Picture 12).
 Main regions of activity
Marine fishery companies are distributed unequally on the territory of the country. Most of the companies are registered in Sakhalin region and Kamchatka territory. Both regions locate on the Pacific coast accommodating the largest fish resources (Picture 13). TOP-1000 companies are registered in 46 regions of Russia.
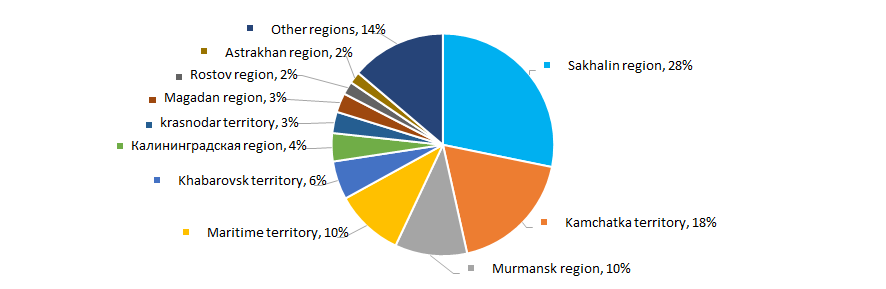 Picture 13. Distribution of TOP -1000 companies throughout regions of Russia
 Overwhelming majority of marine fishery companies is centered in the Far Eastern district of the RF (Picture 14).
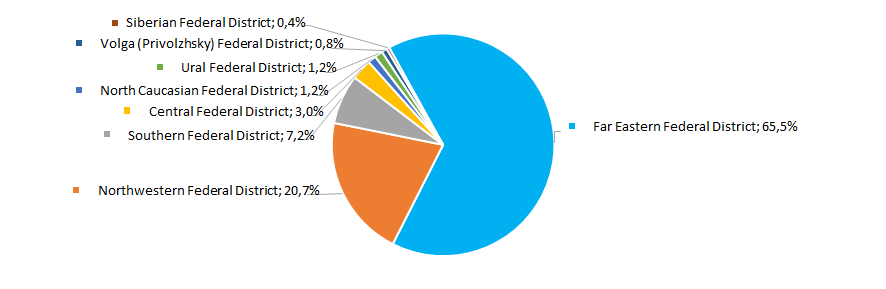 Picture 14. Distribution of TOP-1000 companies throughout federal districts of Russia
 Share of companies from the TOP-1000 group, having branches or representative offices, amounts to 6%.
Participation in arbitration proceedings
More than quarter of companies in the industry does not participate in arbitration proceedings. Most of the companies participate in a negligible number of arbitration cases. (Picture 15).
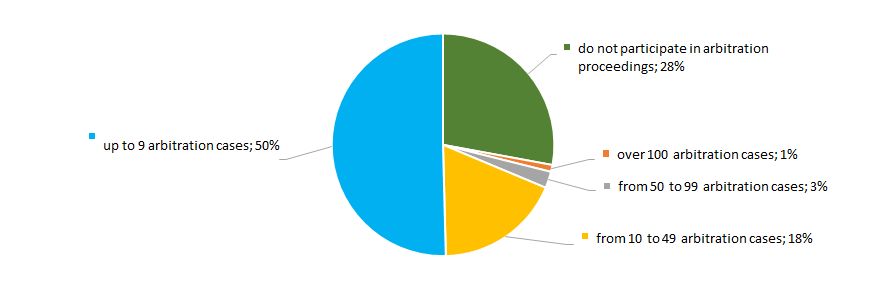 Picture 15. Distribution of TOP -1000 companies by participation in arbitration proceedings
 Reliability index
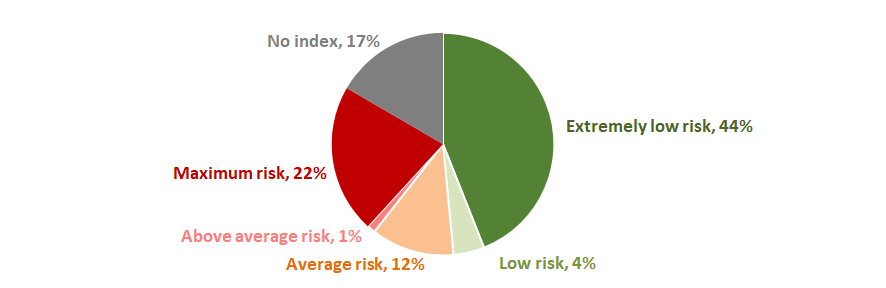
In terms of signs of «fly-by-night» or unreliable companies the majority of companies demonstrate extremely low risk of cooperation (Picture 16).
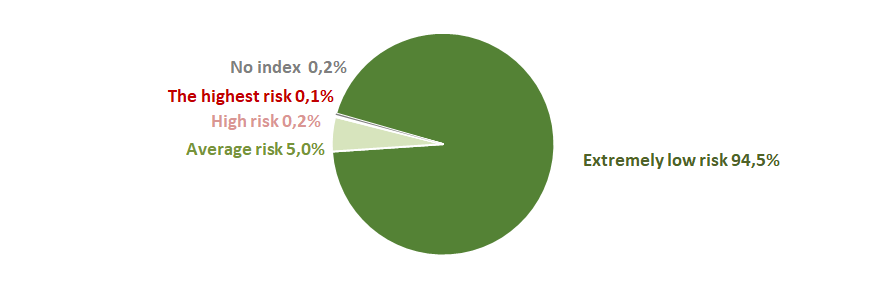 Picture 16. Distribution of TOP -1000 by Reliability index
Financial position score
Assessment of financial state of the sector’s companies indicates that the most of the companies have an average financial standing. However, over a quarter of the TOP-1000 companies have an unstable and critical financial standing (Picture 17).
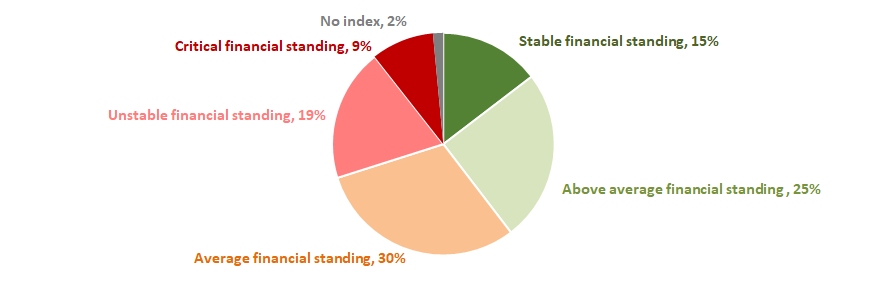 Picture 17. Distribution of TOP -1000 companies by Financial position score
Liquidity index
Almost half of the sector`s companies (48%) demonstrate a minimal or insignificant level of bankruptcy risk in the short-term period. However, the share of enterprises with above average and the highest levels of risk amounts to 23% (Picture 18).
 Picture 18. Distribution of TOP -1000 companies by Liquidity index
Solvency index Globas
Over a half of the TOP-1000 marine fishery companies (54%) have got from superior to medium Solvency index Globas (Picture 19).
Together with key indexes, financial figures and ratios, it may demonstrate relatively favorable trends within the industry.
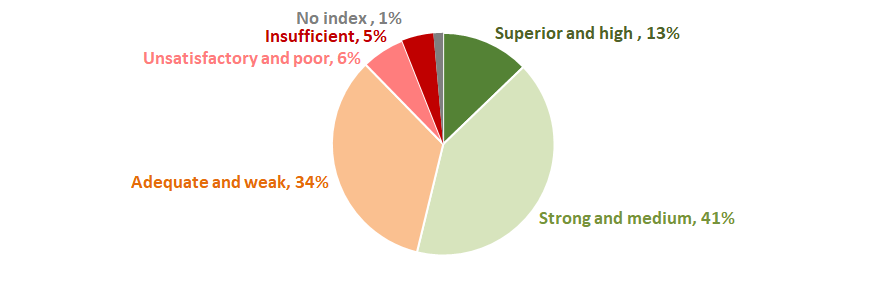 Picture 19. Distribution of TOP -1000 by Solvency index Globas