
Order a report
Custom-made industry research, company ratings, competitor analysis


Net profit ratio of the largest Russian publishing houses
Information agency Credinform represents the ranking of the largest Russian publishing houses. Enterprises with the largest volume of annual revenue (TOP-10) were selected for the ranking, according to the data from the Statistical Register for the latest available periods (for 2015 and 2016). Then they were ranked by net profit ratio (Table 1). The analysis was made on the basis of the data of the Information and Analytical system Globas.
Net profit ratio (%) is calculated as a relation of net profit (loss) to sales revenue and characterizes the level of sales profit. There is no normative value for the indicator. It is recommended to compare enterprises of one industry, or change of the ratio in the course of time of a certain company. A negative value of the ratio indicates a net loss. A high value shows an efficient operation of an enterprise.
The experts of the Information agency Credinform, taking into account the actual situation both in the economy as a whole and in the sectors, has developed and implemented in the Information and Analytical system Globas the calculation of practical values of financial ratios that can be recognized as normal for a particular industry. For publishing houses the practical value of net profit made from 7,78% in 2016.
For getting of the most comprehensive and fair picture of the financial standing of an enterprise it is necessary to pay attention to all combination of indicators and financial ratios.
| Name, INN, region | Revenue, mln RUB | Net profit, mln RUB | Net profit ratio, % | Solvency index Globas | |||
| 2015 | 2016 | 2015 | 2016 | 2015 | 2016 | ||
| 1 | 2 | 3 | 4 | 5 | 6 | 7 | 8 |
| IZDATELSTVO AST LLC INN 7710899593 Moscow Participates as a defendant in arbitration proceedings, there are unclosed writs of execution. |
4 615,6 | 4 405,7 | 330,0 | 1 630,9 | 7,15 | 37,02 | 550 Insufficient |
| YAUZA-KATALOG LLC INN 7721629285 Moscow |
3 698,8 | 8 844,5 | 400,4 | 2 964,2 | 10,82 | 33,51 | 205 Strong |
| IZDATELSTVO PROSVESHCHENIE NJSC INN 7715995942 Moscow |
11 107,9 | 12 646,6 | 5 680,5 | 2 505,0 | 51,14 | 19,81 | 249 Strong |
| KOMMERSANT NJSC INN 7707120552 Moscow |
2 515,1 | 3 087,6 | 30,3 | 376,0 | 1,20 | 12,18 | 185 High |
| IZDATELSTVO E LLC INN 7708188426 Moscow |
7 231,4 | 9 001,8 | 717,3 | 663,3 | 9,92 | 7,37 | 161 Superior |
| IZDATELSTVO YAUZA LLC INN 7707195170 Moscow |
12 622,0 | 14 700,3 | 860,8 | 1 067,5 | 6,82 | 7,26 | 166 Superior |
| YAUZA-PRESS LLC INN 7721562746 Moscow |
13 469,1 | 17 472,5 | 815,2 | 1 167,6 | 6,05 | 6,68 | 169 Superior |
| PUBLISHING HOUSE KOMSOMOLSKAYA PRAVDA NJSC INN 7714037217 Moscow |
3 656,4 | 3 221,3 | 25,5 | 75,9 | 0,70 | 2,36 | 216 Strong |
| AKTION-PRESS LLC INN 7702272022 Moscow |
2 856,0 | 3 320,7 | 0,4 | 26,7 | 0,01 | 0,80 | 254 Medium |
| HEARST SHKULEV MEDIA LLC INN 7708183322 Moscow |
3 598,3 | 3 839,9 | -10,8 | -87,8 | -0,30 | -2,29 | 258 Medium |
| Total by TOP-10 companies | 65 370,6 | 80 540,8 | 8 849,5 | 10 389,4 | |||
| Average value by TOP-10 companies | 6 537,1 | 8 054,1 | 885,0 | 1 038,9 | 9,35 | 12,47 | |
| Industry average value | 19,8 | 22,5 | -1,2 | 1,8 | -6,11 | 7,78 | |
The average value of the net profit ratio of TOP-10 enterprises is much higher than the industry average. One company from the TOP-10 list increased revenue and net profit indicators in 2015 — 2016 compared to previous periods (marked with green filling in columns 2 — 5 of Table 1). Other companies decreased revenue or profit indicators or have a loss (marked with red filling in columns 2 — 5 of Table 1).
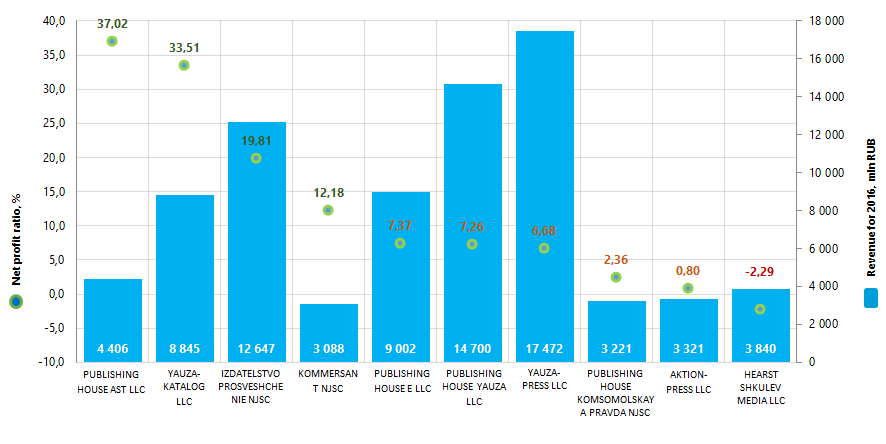 Picture 1. Net profit ratio and revenue of the largest Russian publishing houses (TOP-10)
The industry average indicators of the net profit ratio were below the practical value of 2016 over the past 10 years, with a downward trend (Picture 2).
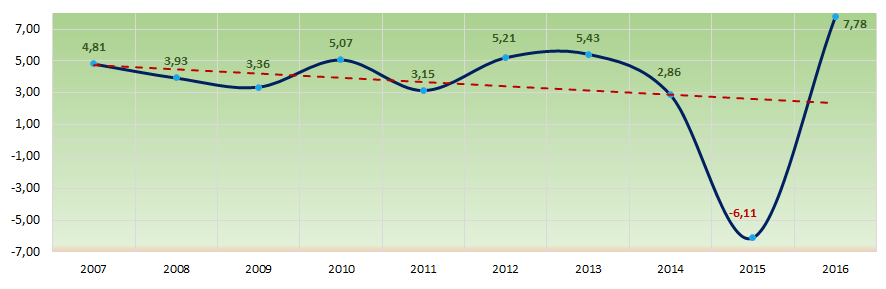 Picture 2. Change in the industry average values of the net profit ratio of the largest Russian publishers in 2007 — 2016