
Order a report
Custom-made industry research, company ratings, competitor analysis


The current assets to equity ratio of the largest Russian air transport companies
The companies with the highest volume of revenue (TOP-10) were selected for this ranking, according to the data from the Statistical Register for the latest available period (for 2016 and 2015). Then they were ranked by current assets to equity ratio (Table 1). The analysis was based on the data from the Information and Analytical system Globas.
Current assets to equity ratio (х) characterizes company’s ability to maintain the level of own working capital and to finance current assets with own sources. The ratio is calculated as the relation of own current assets of a company to total value of equity. The recommended value is from 0,2 to 0,5.
Decrease in the ratio shows slowdown in payment of receivables or tightening of conditions for granting trade credit from contractors. The increase demonstrates the growing opportunity to pay off current liabilities.
The specialists of the Information agency Credinform, taking into account the actual situation in the economy in general as well as in industries, have developed and implemented in the Information and Analytical system Globas the calculation of practical values of financial ratios, which may be considered as normal for a specific industry. For air transport companies the practical value of the current assets to equity ratio in 2016 ranges from 0,45 to 1,00.
For getting of the most comprehensive and fair picture of the financial standing of an enterprise it is necessary to pay attention to all combination of indicators and financial ratios.
| Name, INN, region | Net profit, mln RUB | Revenue, mln RUB | Current assets to equity ratio (x), from 0,2 to 0,5 | Solvency index Globas | |||
| 2015 | 2016 | 2015 | 2016 | 2015 | 2016 | ||
| 1 | 2 | 3 | 4 | 5 | 6 | 7 | 8 |
| LLC NORD WIND INN 7733646084 Moscow |
-270,8 | 6,8 | 26 867,4 | 19 180,1 | 5,31 | 9,27 | 296 Medium |
| UTAIR AVIATION JSC INN 7204002873 Khanty-Mansiysk Autonomous District – Yugra |
-18 426,4 | 589,7 | 49 664,9 | 55 661,7 | 3,90 | 4,23 | 403 Weak |
| LLC AVIAKOMPANIYA POBEDA INN 9705001313 Moscow |
37,2 | 3 332,0 | 11 029,7 | 18 698,5 | 0,81 | 0,83 | 204 Strong |
| LLC GLOBUS INN 5448451904 Novosibirsk region |
139,5 | 966,8 | 18 531,7 | 27 512,0 | 0,60 | 0,66 | 198 High |
| JSC AK URALSKIE AVIALINII INN 6608003013 Sverdlovsk region |
285,3 | 2 691,7 | 43 843,2 | 57 320,5 | -0,88 | 0,17 | 178 High |
| JSC AEROFLOT INN 7712040126 Moscow |
-18 927,8 | 30 616,8 | 366 307,5 | 427 900,5 | -0,55 | 0,04 | 173 Superior |
| JSC SIBERIA AIRLINES INN 5448100656 Novosibirsk region |
922,9 | 2 896,0 | 82 214,5 | 108 110,8 | 0,52 | -0,14 | 176 High |
| KATEKAVIA - LIMITED COMPANY INN 2459007621 Krasnoyarsk territory |
-161,5 | 275,8 | 12 409,8 | 20 976,7 | 1,77 | -0,30 | 251 Medium |
| AIRBRIDGECARGO AIRLINES LLC INN 7704548011 Moscow |
2 853,1 | -1 075,8 | 58 746,1 | 71 484,5 | -0,24 | -1,18 | 282 Medium |
| ROSSIYA AIRLINES JSC INN 7810814522 Saint Petersburg |
817,7 | 904,5 | 38 754,50 | 73 189,0 | -13,46 | -5,60 | 202 Strong |
| Total for TOP-10 companies | -3 273,1 | 4 120,4 | 70 836,9 | 88 003,4 | |||
| Average value for TOP-10 companies | -327,3 | 412,0 | 7 083,7 | 8 800,3 | -0,22 | 0,80 | |
| Average for the industry | -877,4 | 141,8 | 3,411,1 | 3 436,7 | 13,53 | -7,83 | |
The average value of the current assets to equity ratio for TOP-10 companies is within the recommended value and higher than the industry average. None of TOP-10 companies in 2016 has indicators of the ratio within the range of recommended value, four companies – within the range of practical value and higher and six companies – lower than the limit of practical value (marked with green, orange and red colour in columns 6 and 7 of the Table 1 and at the Picture 1, correspondingly). Two companies out of TOP-10 decreased indicators of revenue, net profit or have got loss in 2016 compared to the previous period (marked with red filling in columns 3 and 5 of the Table 1).
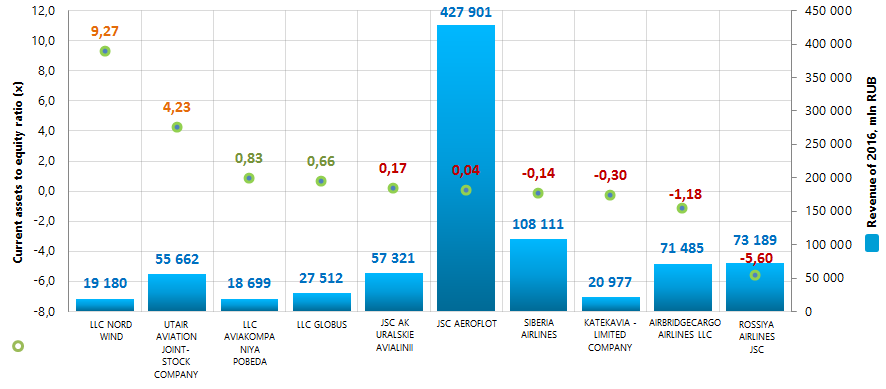 Picture 1. Current assets to equity ratio and revenue of the largest Russian air transport companies (TOP-10)
The average industrial indicators of the current assets to equity ratio for the last 10 years were within the range of recommended or practical only in 2012-2013 (Picture 2). In general, this fact can demonstrate negative tendency in the industry.
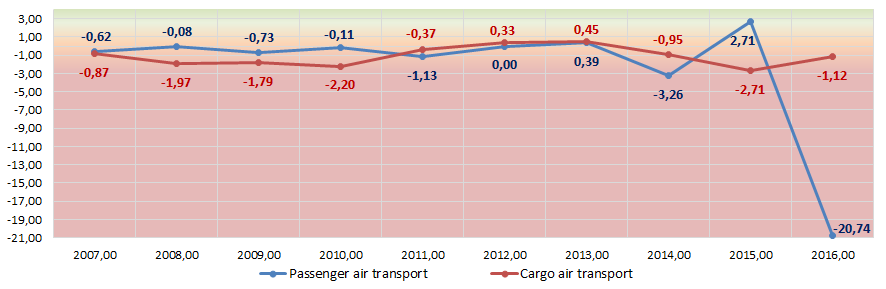 Picture 2. Change of average industrial values of the current assets to equity ratio of the largest Russian air transport companies in 2007 – 2016
 Nine companies out of TOP-10 have got high levels of solvency index Globas, that shows their ability to pay off their debts in time and fully.
UTAIR AVIATION JSC has got satisfactory solvency index Globas, because of the information about their participation as defendants in arbitration court proceedings for the last 2 years, late performance of obligations, cases of unclosed enforcement orders and loss in the structure of balance sheet ratios. Forecast of the ratio development is negative.