
Order a report
Custom-made industry research, company ratings, competitor analysis


Changes in legislation
The Supreme Court of Russia adopted a provision tightening the rules concerning consideration of requests of investigating authorities for arrest on charges of fraud.
The provision requires the courts to conduct a special fact-check that a possible crime is not directly related to entrepreneurial activity. This concerns the charges under the Articles of the Criminal Code of the Russian Federation:
- part 1 of the Article 159 Fraud;
- part 2 of the Article 159 Fraud committed by a group of persons by prior conspiracy, as well as causing significant damage to a citizen;
- part 3 of the Article 159 Fraud committed by a person using the official position, as well as large-scale fraud;
- part 4 of the Article 159 Fraud committed by an organized group either on an especially large scale or involving the deprivation of a citizen's right to a housing;
- 159.1 Credit fraud;
- 159.2 Payout fraud;
- 159.3 Electronic payment fraud;
- 159.5 Insurance fraud;
- 159.6 Fraud in the cyber realm;
- 160 Misappropriation or embezzlement;
- 165 Causing property damage through fraud or breach of trust;
- 201 Abuse of authority.
Such checks should be carried out at each request of the investigating authorities for the application of preventive measures in the form of detention in respect of suspected or accused individuals who are individual entrepreneurs or members of management bodies of commercial organizations.
In particular, the decisions on the initiation of motions and the materials annexed to the decisions must be checked for the availability of specific information confirming the conclusion that the alleged crime is not connected with:
- entrepreneurial activity,
- management of property used for business purposes,
- exercise of authority to manage a company,
- conduct by a commercial organization of entrepreneurial or other economic activity.
Thus, now the investigating authorities in their petitions are obliged to prove that the alleged crimes are not directly related to the economic activities of the accused persons. In the absence of such evidence, applications must be rejected.
Indications of mercenary motives of suspected (accused) persons or disposition of stolen property cannot be grounds for recognition of acts committed outside of entrepreneurial activity.
According to the information of the General Prosecutor's Office of the Russian Federation, over the past five years, the number of persons who have committed crimes and hold positions in a commercial or other organization related to the execution of management functions has a trend to increase (Picture 1).
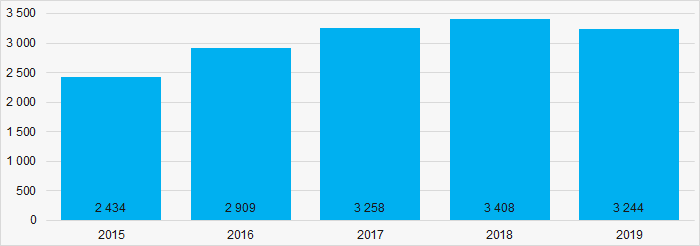 Picture 1. Change in the number of perpetrators of crimes holding positions in a commercial or other organization related to the execution of management functions in 2015 - 2019