Characteristics of the largest taxpayers
Amendments were made by the Order of the Federal Tax Service of Russia (FTS) as of September 27, 2019 № ММВ-7-22/487@ to the corresponding formerly published orders, regarding criteria for being qualified as the largest taxpayers and subjected to tax administration in the specified interregional inspectorates of the FTS.
In particular, the organizations are qualified as the largest taxpayers, if the total volume of income is within an interval from 10 to 35 billion RUB, or exceeds 35 billion RUB. This regards to Russian organizations, branches, representative offices or other separate subdivisions of foreign organizations.
Besides, companies, falling outside the above-mentioned criteria also may be classified as the largest taxpayers, in relation of which were taken decisions by tax authorities on tax monitoring according to the Article 105.27 of the Tax Code of Russia. Let us remind that this article of the tax Code of Russia regulates order of taking decision to conduct (or to refuse to conduct) tax monitoring and procedure of its` execution.
According to the data from the Information and Analytical system Globas currently there are more than 2,5 thousand companies in Russia, which total income for 2018 exceeds 10 billion RUB. Full information is available for the subscribers of Globas.
Profit margin of wine producers
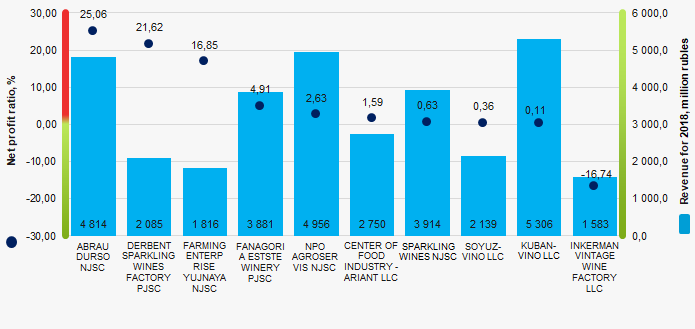
Information agency Credinform represents the ranking of the largest Russian wine producers. Companies with the largest volume of annual revenue (TOP-10), specializing in grape growing and wine production, were selected for the ranking, according to the data from the Statistical Register for the latest available periods (for 2016 - 2018). Then they were ranked by the net profit ratio (Table 1). The analysis was made on the basis of the data of the Information and Analytical system Globas.
The net profit ratio (%) is calculated as the relation of net profit (loss) to sales revenue and characterizes the level of sales profit.
A normative value for the indicator is not specified. For comparison the enterprises of one industry are recommended, or the dynamics of the ratio for a particular company. A negative value of the indicator points to a net loss. A high value of the indicator points to the efficient operation of an enterprise.
The experts of the Information agency Credinform, taking into account the actual situation both in the economy as a whole and in the sectors, have developed and implemented in the Information and Analytical system Globas the calculation of practical values of financial ratios that can be recognized as normal for a particular industry. For wine producers the practical value of the net profit ratio is from 1,15%.
For getting of the most comprehensive and fair picture of the financial standing of an enterprise it is necessary to pay attention to all combination of indicators and financial ratios.
| Name, INN, region | Revenue, billion RUB | Net profit (loss), billion RUB | Net profit ratio, % | Solvency index Globas | |||
| 2017 | 2018 | 2017 | 2018 | 2017 | 2018 | ||
| 1 | 2 | 3 | 4 | 5 | 6 | 7 | 8 |
| ABRAU-DURSO NJSC INN 2315092440 Krasnodar territory |
 4245,4 4245,4 |
 4813,6 4813,6 |
 606,0 606,0 |
 1206,3 1206,3 |
 14,27 14,27 |
 25,06 25,06 |
166 Superior |
| DERBENT SPARKLING WINES FACTORY PJSC INN 0542001269 Republic of Dagestan |
 2017,5 2017,5 |
 2084,9 2084,9 |
 241,9 241,9 |
 450,7 450,7 |
 11,99 11,99 |
 21,62 21,62 |
223 Strong |
| FARMING ENTERPRISE YUJNAYA NJSC INN 2352000493 Krasnodar territory |
 3408,7 3408,7 |
 1815,7 1815,7 |
 1652,9 1652,9 |
 306,0 306,0 |
 48,49 48,49 |
 16,85 16,85 |
200 Strong |
| FANAGORIA ESTATE WINERY PJSC INN 2352002170 Krasnodar territory |
 3698,9 3698,9 |
 3881,2 3881,2 |
 325,8 325,8 |
 190,7 190,7 |
 8,81 8,81 |
 4,91 4,91 |
214 Strong |
| NPO AGROSERVIS NJSC INN 7706138620 Moscow region |
 3547,6 3547,6 |
 4955,8 4955,8 |
 89,2 89,2 |
 130,6 130,6 |
 2,51 2,51 |
 2,63 2,63 |
195 High |
| CENTER OF FOOD INDUSTRY - ARIANT LLC INN 7423012592 Chelyabinsk region |
 2932,3 2932,3 |
 2749,7 2749,7 |
 69,7 69,7 |
 43,8 43,8 |
 2,38 2,38 |
 1,59 1,59 |
247 Strong |
| SPARKLING WINES NJSC INN 7830001010 Saint-Petersburg |
 4112,2 4112,2 |
 3914,0 3914,0 |
 130,9 130,9 |
 24,6 24,6 |
 3,18 3,18 |
 0,63 0,63 |
238 Strong |
| SOYUZ-VINO LLC INN 2337028367 Krasnodar territory |
 1839,8 1839,8 |
 2138,8 2138,8 |
 85,4 85,4 |
 7,7 7,7 |
 4,64 4,64 |
 0,36 0,36 |
226 Strong |
| KUBAN-VINO LLC INN 2352034598 Krasnodar territory |
 4770,6 4770,6 |
 5306,4 5306,4 |
 0,6 0,6 |
 5,7 5,7 |
 0,01 0,01 |
 0,11 0,11 |
239 Strong |
| INKERMAN VINTAGE WINE FACTORY LLC INN 9202002720 Sevastopol |
 1812,4 1812,4 |
 1582,6 1582,6 |
 428,4 428,4 |
 -264,9 -264,9 |
 23,64 23,64 |
 -16,74 -16,74 |
330 Adequate |
| Total by TOP-10 companies |  32385,3 32385,3 |
 33242,7 33242,7 |
 3630,8 3630,8 |
 2101,2 2101,2 |
|||
| Avearge value by TOP-10 companies |  3238,5 3238,5 |
 3324,3 3324,3 |
 363,1 363,1 |
 210,1 210,1 |
 11,99 11,99 |
 5,70 5,70 |
|
| Industry average value |  390,8 390,8 |
 454,2 454,2 |
 8,1 8,1 |
 5,2 5,2 |
 2,08 2,08 |
 1,15 1,15 |
|
 improvement of the indicator to the previous period,
  slowdown in the indicator to the previous period.
The average value of the net profit ratio of TOP-10 enterprises in 2018 is above industry average and practical values. Four companies improved the results in 2018.
 Picture 1. Net profit ratio and revenue of the largest wine producers (TOP-10)
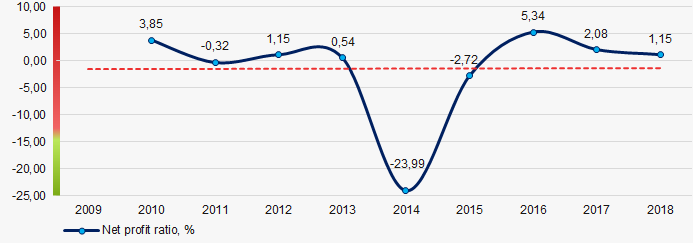
The industry average indicators of the net profit ratio have a downward trend over the course of 10 years (Picture 2).
 Picture 2. Change in the industry average values of the net profit ratio of wine producers in 2009 – 2018